OPEN-SOURCE SCRIPT
Güncellendi Multi Oscillators Price Levels

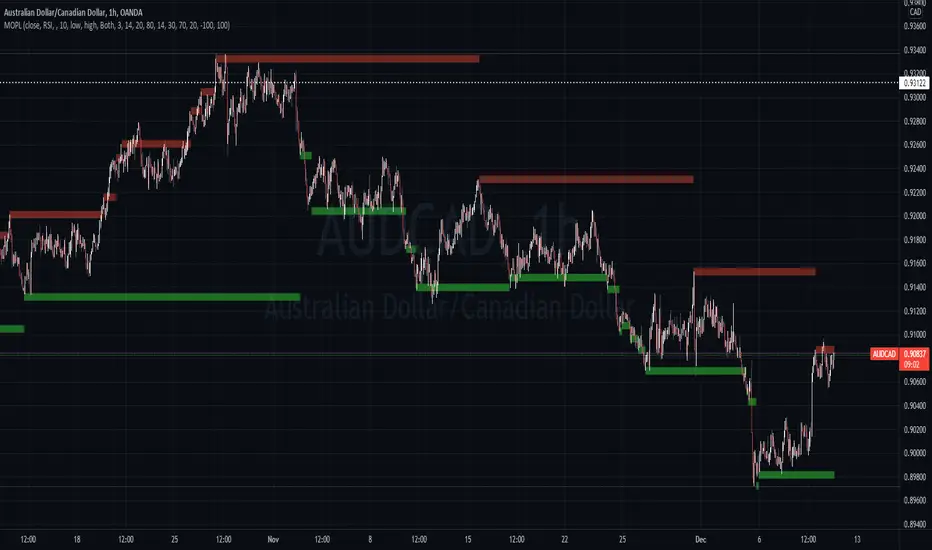
This script draws price levels corresponding to the highest price reached in overbought situations, and the lowest price reached in oversold situations, depending on the oscillator and the timeframe the user has configured.
These levels correspond, most of time, to good supports and resistances prices.
Price levels drawings can be based on the following indicators:
You can customize this indicator with the following options:
Here are a few examples of different configurations:


This script will probably be modified in the future, don't hesitate to suggest any improvement.
These levels correspond, most of time, to good supports and resistances prices.
Price levels drawings can be based on the following indicators:
- Stochastic RSI (default)
- Stochastic CCI
- RSI
- CCI
You can customize this indicator with the following options:
- Source: The candle source to use in indicators calculation
- Source Indicator: The indicator on which you cant to base your levels
- Timeframe: The timeframe on which you want to apply the selected indicator, and calculate levels
- Show supports/resistances: enable/disable price levels, depending on there status (overbought - resistances) / (oversold - supports)
- Lines width: width of price levels. (set to 10 by default in order to draw "zones")
- Supports/Resistances source: Select the candle data you cant to use to draw supports and resistances levels
- Extend levels: Select the line extension for price levels
- Levels color: Select the desired color for price levels
- And of course , all parameters corresponding to the supported indicators (Stoch, RSI, CCI)
Here are a few examples of different configurations:
This script will probably be modified in the future, don't hesitate to suggest any improvement.
Sürüm Notları
Updates:- Supports and resistances are now represented in different colors
- Default timeframe is now the current one
- Support and resistances are not extended anymore in order to avoid chart overloading
- Default parameters are now RSI(14) based on the candles closing price
Sürüm Notları
Levels extension added, but set to None by defaultAçık kaynak kodlu komut dosyası
Gerçek TradingView ruhuyla, bu komut dosyasının mimarı, yatırımcıların işlevselliğini inceleyip doğrulayabilmesi için onu açık kaynaklı hale getirdi. Yazarı tebrik ederiz! Ücretsiz olarak kullanabilseniz de, kodu yeniden yayınlamanın Topluluk Kurallarımıza tabi olduğunu unutmayın.
Feragatname
Bilgiler ve yayınlar, TradingView tarafından sağlanan veya onaylanan finansal, yatırım, alım satım veya diğer türden tavsiye veya öneriler anlamına gelmez ve teşkil etmez. Kullanım Koşulları bölümünde daha fazlasını okuyun.
Açık kaynak kodlu komut dosyası
Gerçek TradingView ruhuyla, bu komut dosyasının mimarı, yatırımcıların işlevselliğini inceleyip doğrulayabilmesi için onu açık kaynaklı hale getirdi. Yazarı tebrik ederiz! Ücretsiz olarak kullanabilseniz de, kodu yeniden yayınlamanın Topluluk Kurallarımıza tabi olduğunu unutmayın.
Feragatname
Bilgiler ve yayınlar, TradingView tarafından sağlanan veya onaylanan finansal, yatırım, alım satım veya diğer türden tavsiye veya öneriler anlamına gelmez ve teşkil etmez. Kullanım Koşulları bölümünde daha fazlasını okuyun.