OPEN-SOURCE SCRIPT
Standard Deviation W/Q/M Pivots
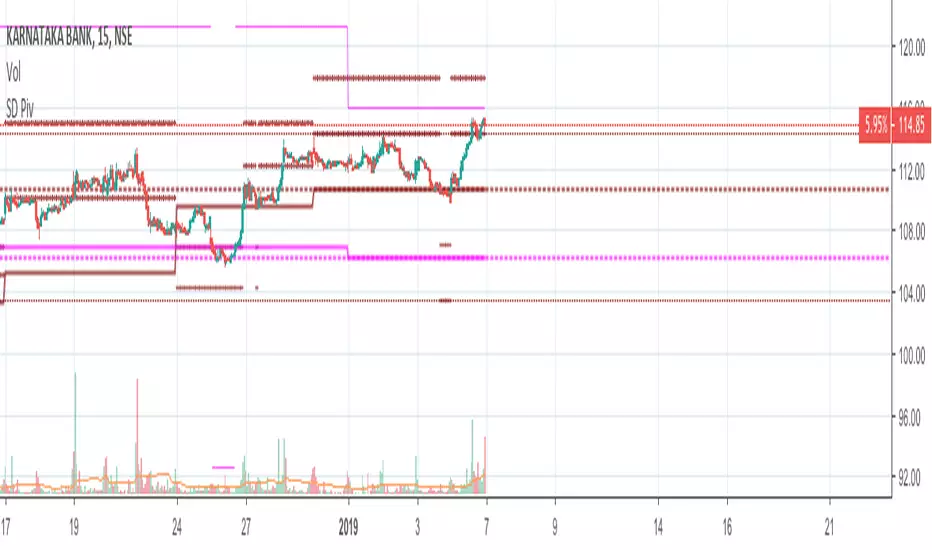
This is a re-iteration of the standard deviation of daily pivots with the pivots applied on weekly, monthly, quarterly and yearly levels. For intraday traders the weekly pivot points will act as a major support resistance levels. Quarterly and monthly pivot points are useful for short-term positions while the yearly pivot determines the stock's long term support-resistance levels and useful in determining if the stock is in a bullish/bearish leg.
Açık kaynak kodlu komut dosyası
Gerçek TradingView ruhuyla, bu komut dosyasının mimarı, yatırımcıların işlevselliğini inceleyip doğrulayabilmesi için onu açık kaynaklı hale getirdi. Yazarı tebrik ederiz! Ücretsiz olarak kullanabilseniz de, kodu yeniden yayınlamanın Topluluk Kurallarımıza tabi olduğunu unutmayın.
Feragatname
Bilgiler ve yayınlar, TradingView tarafından sağlanan veya onaylanan finansal, yatırım, alım satım veya diğer türden tavsiye veya öneriler anlamına gelmez ve teşkil etmez. Kullanım Koşulları bölümünde daha fazlasını okuyun.