TSI.LTA | Base BTC 1D
Is a trend‑following strategy for Bitcoin on the 1D timeframe that also performs effectively across other major cryptocurrencies.
It aims to capture primary directional moves while filtering out short‑term noise, prioritizing clarity, consistency, and robust risk management. In other words, maximize profits minimizing draw downs. “The key is to limit your losses; let your profits take care of themselves.” — Mark Minervini
All signals are confirmed at candle close — ⚡ no repainting — making it reliable for alerts, automation, and backtesting integrity.
────────────────────────────
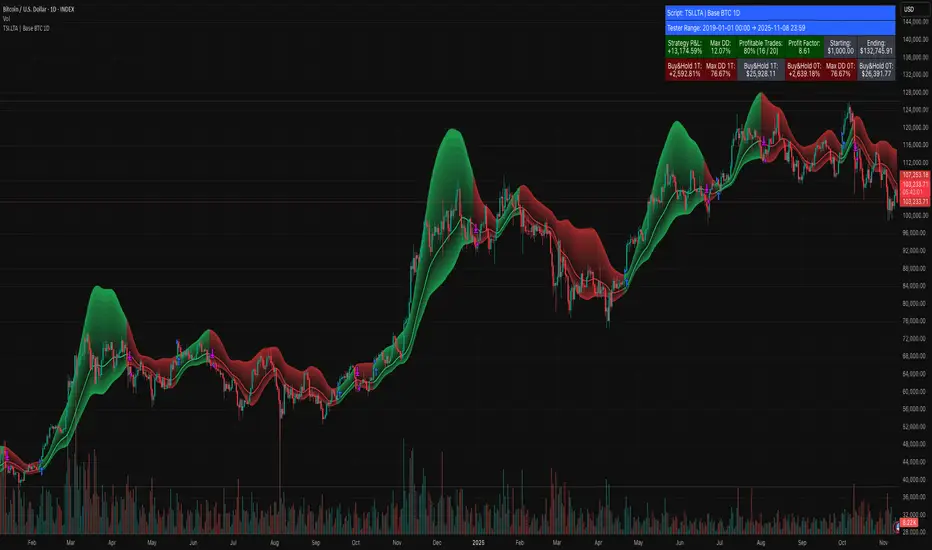
📊 Backtesting & What the HUD Shows (default 2019 → present)
The screenshots summarize results from back testing January 2019 → Nov 8th ‘25
The integrated on‑chart HUD (colored header table) displays the key performance metrics at a glance:
💹Strategy P&L (13,174.95%) — cumulative percentage return over the test range.
📉Max DD (12.07%) — maximum peak‑to‑trough equity drawdown.
🏆Profitable Trades (80%)(16/20) — focused and selective, prioritizing quality over quantity. Indicative of stable consistency.
📈Profit Factor (8.61) — gross profit divided by gross loss; values > 2 signal robustness.
💵Starting / Ending Equity ($1,000 → $132,745.91) — capital progression through the period.
Buy & Hold Baselines📊:
🔹1T — Max DD (76.67%): from the first real strategy entry (apples‑to‑apples vs signal exposure, 1 trade).
🔹0T — Max DD (76.67%): from the test start (classic Buy & Hold, 0 trades).
For both, the HUD displays return (%), USD, and Max DD — making it clear how the strategy outperforms Buy & Hold with much lower drawdowns.
💡 Tip: Enable “Plot Strategy Equity (cash‑flat, stepline)” to see the equity rise only when in a position and remain flat in cash – a true performance visualization versus Buy & Hold.
📅 All data corresponds to verified run dated 2025‑11‑08.
────────────────────────────
⚙️ Risk Management Inputs
The strategy includes configurable parameters so traders can fine‑tune risk and reward without changing core logic:
🔹Enable Stop Loss (%): activates a defensive control. A 6% SL (as in examples) significantly improves profitability while maintaining low drawdowns (~12%).
🔹Enable Take Profit (%): automatically secures gains at a chosen target.
🔹Fixed SL/TP Price + Activation Date: absolute control with optional activation date.
🔹Enable Trailing Stop (%): trailing protection that dynamically follows peaks, with detection on a lower timeframe for better precision.
────────────────────────────
🧭 Philosophy
Designed to follow macro trends, reduce emotional trading, and control drawdowns.
As markets approach late‑cycle phases, the emphasis shifts from maximizing every gain to protecting capital and preserving smooth growth.
────────────────────────────
🔬 How to Test (Strongly Encouraged)
*Run 2019 → present to span the entire modern market cycle (COVID crash, halvings, ETF flow).
*Run 2023 → present to study the current bull leg and volatility expansion.
*Explore windows like:
🔹Post‑halving expansions
🔹Breakout ranges
🔹Long consolidations
Suggested toggles:
*Stop Loss: 6–8%
*Trailing Stop: 6–10%
⚠️The HUD (Draw Tester) and equity curve update instantly, allowing quick return ↔ drawdown trade‑off visualization.
────────────────────────────
🤖 Automation
Because signals confirm at candle close and the system does not repaint, it’s automation‑ready for consistent live execution.
It integrates smoothly with third‑party tools like Signum (non‑affiliated, educational mention only).
────────────────────────────
🔑 Key Characteristics
- ✅ No Repainting — signals finalize at candle close.
- ✅ Trend‑Based Logic — aligned with macro market direction.
- ✅ Volatility‑Adaptive Filters — (DEMA → Gaussian → SMMA + SD).
- ✅ Backtest‑Proven Robustness across multiple cycles.
- ✅ Automation‑Friendly HUD + stepline equity for transparent performance.
────────────────────────────
⚖️ Disclaimer
This strategy is for educational and research purposes only — not financial advice.
Users are fully responsible for their own risk inputs (Stop Loss, Take Profit, Trailing Stop, Volume filters).
While a 6% SL has historically reduced drawdown and improved returns, outcomes vary across assets and timeframes.
Always backtest thoroughly and use a demo environment before deploying live capital.
Yalnızca davetli komut dosyası
Only users approved by the author can access this script. You'll need to request and get permission to use it. This is typically granted after payment. For more details, follow the author's instructions below or contact info_tsi_lat directly.
TradingView does NOT recommend paying for or using a script unless you fully trust its author and understand how it works. You may also find free, open-source alternatives in our community scripts.
Yazarın talimatları
Feragatname
Yalnızca davetli komut dosyası
Only users approved by the author can access this script. You'll need to request and get permission to use it. This is typically granted after payment. For more details, follow the author's instructions below or contact info_tsi_lat directly.
TradingView does NOT recommend paying for or using a script unless you fully trust its author and understand how it works. You may also find free, open-source alternatives in our community scripts.