OPEN-SOURCE SCRIPT
Güncellendi Pearson Correlation [Mr_Rakun]
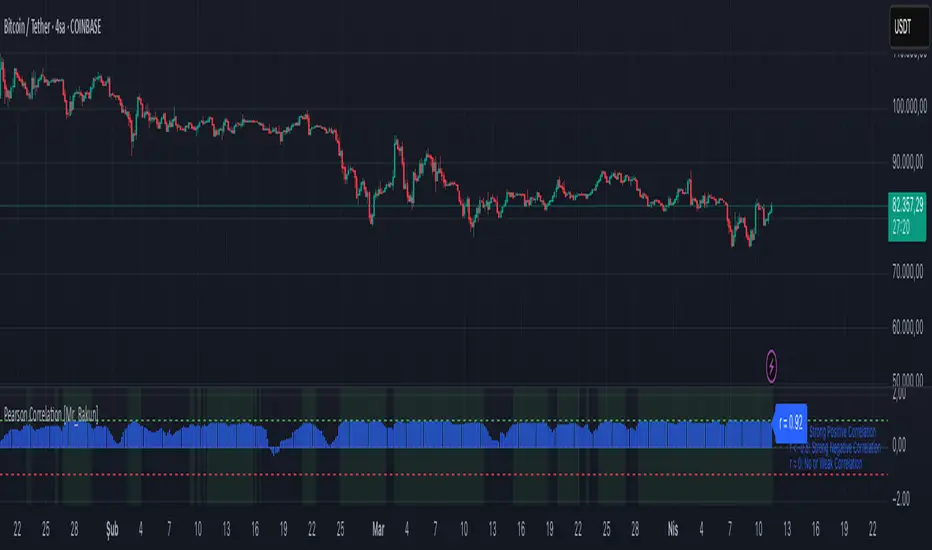
Pearson Correlation
This script calculates the Pearson correlation coefficient (r) between the closing price of the current asset and another selected asset.
🔍 How It Works:
• The user selects a correlation period (default: 20) and a symbol (default: ETH/USDT).
• The script retrieves the closing prices of both assets.
• The Pearson correlation formula is applied:
r = \frac{n(\sum xy) - (\sum x)(\sum y)}{\sqrt{[n\sum x^2 - (\sum x)^2][n\sum y^2 - (\sum y)^2]}}
• The correlation is plotted as a histogram:
• +1 (green line) → Perfect positive correlation
• -1 (red line) → Perfect negative correlation
• 0 (gray line) → No correlation
📊 Why Use This?
This indicator helps traders identify relationships between assets, such as whether two markets move together or inversely. It is useful for hedging strategies, portfolio diversification, and market comparisons.
Sürüm Notları
- InfoAçık kaynak kodlu komut dosyası
Gerçek TradingView ruhuyla, bu komut dosyasının mimarı, yatırımcıların işlevselliğini inceleyip doğrulayabilmesi için onu açık kaynaklı hale getirdi. Yazarı tebrik ederiz! Ücretsiz olarak kullanabilseniz de, kodu yeniden yayınlamanın Topluluk Kurallarımıza tabi olduğunu unutmayın.
Feragatname
Bilgiler ve yayınlar, TradingView tarafından sağlanan veya onaylanan finansal, yatırım, alım satım veya diğer türden tavsiye veya öneriler anlamına gelmez ve teşkil etmez. Kullanım Koşulları bölümünde daha fazlasını okuyun.
Açık kaynak kodlu komut dosyası
Gerçek TradingView ruhuyla, bu komut dosyasının mimarı, yatırımcıların işlevselliğini inceleyip doğrulayabilmesi için onu açık kaynaklı hale getirdi. Yazarı tebrik ederiz! Ücretsiz olarak kullanabilseniz de, kodu yeniden yayınlamanın Topluluk Kurallarımıza tabi olduğunu unutmayın.
Feragatname
Bilgiler ve yayınlar, TradingView tarafından sağlanan veya onaylanan finansal, yatırım, alım satım veya diğer türden tavsiye veya öneriler anlamına gelmez ve teşkil etmez. Kullanım Koşulları bölümünde daha fazlasını okuyun.