OPEN-SOURCE SCRIPT
Güncellendi Minervini breakout - Anduril
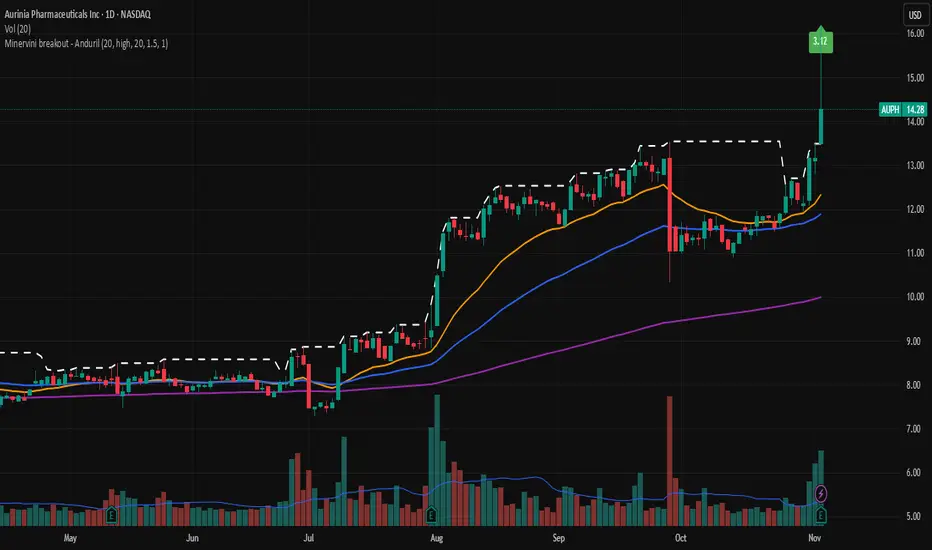
This indicator checks the Mark Minerivini trend template as well checks consolidation areas and breakout.
Checks the highest closing price of last x days (default 20 days), exluding current day and draws a white dashed line, Calculates the relative volume of the current day. Calculates EMA 21, EMA50 and EMA200 and draws on the graph to define trend.
Gives a buy signal in green (writing relative strength of that day inside of green arrow) if:
1) Current price> breakout price* 0.98
2) Current price > EMA21 >EMA50>EMA200
3) Current price > 52 week high*0.75
4) Current price > 52 week low*1.3
5) EMA 200 of today > EMA 200 of 10 bar ago > EMA 200 of 20 bar ago
6) Relative volume of the day > 1.5
Sürüm Notları
Hello, there was an issue on the 1st version of the code to calculate the updated breakout line daily now there is a tariling line which can be adjusted.Now you will also be able to set the breakout level and relative volume to get proper signal according to your needs.
-----------------------------
This indicator checks the Mark Minerivini trend template as well consolidation areas and breakout. It is not a direct buy signal strategy, but more like a filter rather than looking at many different stock prices one by one. i designed it to put as an alert to my watchlist so it can tell me which of my followed assets are breaking out.
-It checks the highest closing price of last x days (default 20 days), exluding current day and draws a white dashed line. Defines as breakout price. You can set a lower or higher breakout level from this level by adjusting Breakout Tolerance from the sttings. Lower then 1 means you will get an earlier signal before breakout if all other conditions are met.
-Calculates the relative volume of the current day. You can set the relative volume threshold (default >1.5) and relative Volume period to calculate average volume (default 20 days) for relative volume calculation.
-Calculates EMA 21, EMA50 and EMA200 and draws on the graph to define trend.
This indicator works in real time throughout the day, and as soon as all the below criteria are met at that moment, it will generate a buy signal in green arrow(writing relative strength of that day inside of the arrow):
1) Current price> breakout price
2) Current price > EMA21 >EMA50>EMA200
3) Current price > 52 week high*0.75
4) Current price > 52 week low*1.3
5) EMA 200 of today > EMA 200 of 10 bar ago > EMA 200 of 20 bar ago
6) Relative volume of the day > 1.5
For example:
If the price moves above the breakout level but the volume is low, the signal will not be produced yet.
During the day, if the price and other technical conditions are satisfied but the volume has not increased, the “buy” label/signal will not appear.
Later in the session, if the volume rises and the relative volume threshold (e.g. 1.5) is exceeded—while all other criteria are still satisfied—the indicator will immediately generate the signal and plot the arrow/label on the chart.
So the signal is not dependent on bar close—it will appear on TradingView as soon as all the criteria are met in real time, along with the arrow label. The indicator’s alert function will also be triggered at that moment.
Sürüm Notları
There was a bug on the calculation of the breakout price. Corrected. Sürüm Notları
Now you will be able to chose Close/High prices from settings to define the breakout level.Açık kaynak kodlu komut dosyası
Gerçek TradingView ruhuyla, bu komut dosyasının yaratıcısı, yatırımcıların işlevselliğini inceleyip doğrulayabilmesi için onu açık kaynaklı hale getirdi. Yazarı tebrik ederiz! Ücretsiz olarak kullanabilseniz de, kodu yeniden yayınlamanın Topluluk Kurallarımıza tabi olduğunu unutmayın.
Feragatname
Bilgiler ve yayınlar, TradingView tarafından sağlanan veya onaylanan finansal, yatırım, alım satım veya diğer türden tavsiye veya öneriler anlamına gelmez ve teşkil etmez. Kullanım Koşulları bölümünde daha fazlasını okuyun.
Açık kaynak kodlu komut dosyası
Gerçek TradingView ruhuyla, bu komut dosyasının yaratıcısı, yatırımcıların işlevselliğini inceleyip doğrulayabilmesi için onu açık kaynaklı hale getirdi. Yazarı tebrik ederiz! Ücretsiz olarak kullanabilseniz de, kodu yeniden yayınlamanın Topluluk Kurallarımıza tabi olduğunu unutmayın.
Feragatname
Bilgiler ve yayınlar, TradingView tarafından sağlanan veya onaylanan finansal, yatırım, alım satım veya diğer türden tavsiye veya öneriler anlamına gelmez ve teşkil etmez. Kullanım Koşulları bölümünde daha fazlasını okuyun.