RicardoSantos

[RS]RSI Mirrors V2

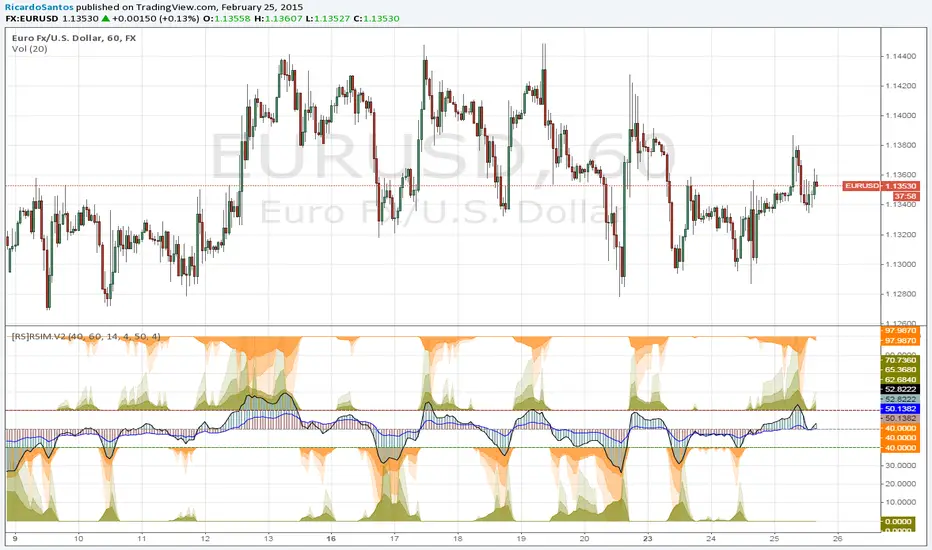
EXPERIMENTAL: Updated version with smoothing options for the rsi's.
Açık kaynak kodlu komut dosyası

Gerçek TradingView ruhuyla, bu betiğin yazarı, yatırımcının anlayabilmesi ve doğrulayabilmesi için onu açık kaynak olarak yayınladı. Yazarın eline sağlık! Bunu ücretsiz olarak kullanabilirsiniz, ancak bu kodun bir yayında yeniden kullanımı Kullanım Koşulları ile yönetilir. Bir grafikte kullanmak için favorilere ekleyebilirsiniz.

Feragatname

Bilgiler ve yayınlar, TradingView tarafından sağlanan veya onaylanan finansal, yatırım, işlem veya diğer türden tavsiye veya tavsiyeler anlamına gelmez ve teşkil etmez. Kullanım Şartları'nda daha fazlasını okuyun.

Bu komut dosyasını bir grafikte kullanmak ister misiniz?
study(title="[RS]RSI Mirrors V2", shorttitle="[RS]RSIM.V2", overlay=false)

buylimit = input(40)
selllimit = input(60)

source = close

rsi1 = sma(rsi(source, input(14, title="Fast RSI Length")), input(4, title="Fast RSI MA Smooth"))
rsi2 = sma(rsi(source, input(50, title="Slow RSI Length")), input(4, title="Slow RSI MA Smooth"))
//  ||---
excess = rsi2-rsi1
posexcess = excess > 0 ? buylimit-excess : buylimit
negexcess = excess < 0 ? selllimit-excess : selllimit

posexcess1 = excess > 0 ? rising(excess, 1) ? buylimit-excess*2 : buylimit-excess*0.75 : buylimit
negexcess1 = excess < 0 ? falling(excess, 1) ? selllimit-excess*2 : selllimit-excess*0.75 : selllimit
posexcess2 = excess > 0 ? rising(excess, 1) ? buylimit-excess*4 : buylimit-excess*0.75 : buylimit
negexcess2 = excess < 0 ? falling(excess, 1) ? selllimit-excess*4 : selllimit-excess*0.75 : selllimit

posfilter = posexcess < 0 ? 0 : posexcess
posfilter1 = posexcess1 < 0 ? 0 : posexcess1
posfilter2 = posexcess2 < 0 ? 0 : posexcess2
negfilter = negexcess > 100 ? 100 : negexcess
negfilter1 = negexcess1 > 100 ? 100 : negexcess1
negfilter2 = negexcess2 > 100 ? 100 : negexcess2

plot(posfilter, style=area, color=orange, transp=55, histbase=buylimit)
plot(negfilter, style=area, color=olive, transp=55, histbase=selllimit)
plot(posfilter1, style=area, color=orange, transp=70, histbase=buylimit)
plot(negfilter1, style=area, color=olive, transp=70, histbase=selllimit)
plot(posfilter2, style=area, color=orange, transp=85, histbase=buylimit)
plot(negfilter2, style=area, color=olive, transp=85, histbase=selllimit)
//  ||---   Mirroring
posmirror = excess > 0 ? rising(excess, 1) ? 0+excess*0.75 : 0+excess*1 : 0
posmirror1 = excess > 0 ? rising(excess, 1) ? 0+excess*0.75 : 0+excess*2 : 0
posmirror2 = excess > 0 ? rising(excess, 1) ? 0+excess*0.75 : 0+excess*4 : 0
negmirror = excess < 0 ? falling(excess, 1) ? 100+excess*0.75 : 100+excess : 100
negmirror1 = excess < 0 ? falling(excess, 1) ? 100+excess*0.75 : 100+excess*2 : 100
negmirror2 = excess < 0 ? falling(excess, 1) ? 100+excess*0.75 : 100+excess*4 : 100

posmfilter = posmirror > buylimit ? buylimit : posmirror
posmfilter1 = posmirror1 > buylimit ? buylimit : posmirror1
posmfilter2 = posmirror2 > buylimit ? buylimit : posmirror2
negmfilter = negmirror < selllimit ? selllimit : negmirror
negmfilter1 = negmirror1 < selllimit ? selllimit : negmirror1
negmfilter2 = negmirror2 < selllimit ? selllimit : negmirror2

plot(posmfilter, style=area, color=olive, transp=55, histbase=0)
plot(negmfilter, style=area, color=orange, transp=55, histbase=100)
plot(posmfilter1, style=area, color=olive, transp=70, histbase=0)
plot(negmfilter1, style=area, color=orange, transp=70, histbase=100)
plot(posmfilter2, style=area, color=olive, transp=85, histbase=0)
plot(negmfilter2, style=area, color=orange, transp=85, histbase=100)

//  ||---   Outputs
//  ||---   This need to be last to show on top.
plot(rsi1, color=#98b8be, style=histogram, linewidth=2, histbase=50)
plot(rsi2, color=#be9e98, style=histogram, linewidth=2, histbase=50)

plot(rsi1, color=black, style=line, linewidth=1)
plot(rsi2, color=blue, style=line, linewidth=1)

hline(buylimit, color=green)
hline(selllimit, color=maroon)
hline(50)