OPEN-SOURCE SCRIPT
Güncellendi 1A Monthly P&L Table - Using Library
1A Monthly P&L Table: Track Your Performance Month-by-Month
Overview:
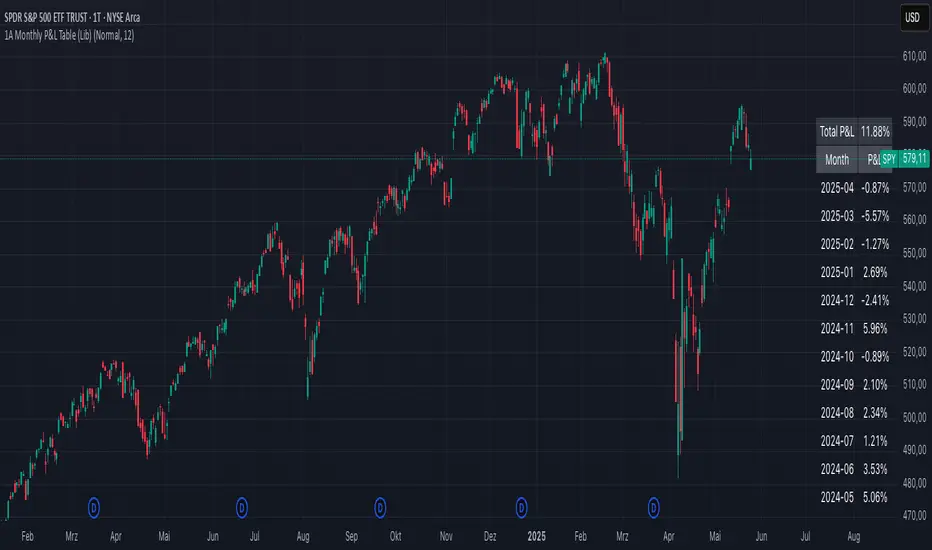
The 1A Monthly P&L Table is a straightforward yet powerful indicator designed to give you an immediate overview of your asset's (or strategy's) percentage performance on a monthly basis. Displayed conveniently in the bottom-right corner of your chart, this tool helps you quickly assess historical gains and losses, making it easier to analyze trends in performance over time.
Key Features:
How It Works:
The indicator calculates the percentage change from the close of the previous month to the close of the current month. For the very first month displayed, it calculates the P&L from the opening price of the chart's first bar to the close of that month. This data is then neatly organized into a table, updated on the last bar of the day or session.
Ideal For:
Settings:
Overview:
The 1A Monthly P&L Table is a straightforward yet powerful indicator designed to give you an immediate overview of your asset's (or strategy's) percentage performance on a monthly basis. Displayed conveniently in the bottom-right corner of your chart, this tool helps you quickly assess historical gains and losses, making it easier to analyze trends in performance over time.
Key Features:
- [] Monthly Performance at a Glance: Clearly see the percentage change for each past month.
[] Cumulative P&L: A running total of the displayed monthly P&L is provided, giving you a quick sum of performance over the selected period.
[] Customizable Display:[] Months to Display: Choose how many past months you want to see in the table (from 1 to 60 months).
[] Text Size: Adjust the text size (Tiny, Small, Normal, Large, Huge) to fit your viewing preferences.
[] Text Color: Customize the color of the text for better visibility against your chart background. - Intraday & Daily Compatibility: The table is optimized to display on daily and intraday timeframes, ensuring it's relevant for various trading styles. (Note: For very long-term analysis on weekly/monthly charts, you might consider other tools, as this focuses on granular monthly P&L.)
How It Works:
The indicator calculates the percentage change from the close of the previous month to the close of the current month. For the very first month displayed, it calculates the P&L from the opening price of the chart's first bar to the close of that month. This data is then neatly organized into a table, updated on the last bar of the day or session.
Ideal For:
- [] Traders and investors who want a quick, visual summary of monthly performance.
[] Analyzing seasonal trends or consistent periods of profitability/drawdown. - Supplementing backtesting results with a clear month-by-month breakdown.
Settings:
- [] Text Color: Changes the color of all text within the table.
[] Text Size: Controls the font size of the table content. - Months to Display: Determines the number of recent months included in the table.
Sürüm Notları
1A Monthly P&L Table: Track Security Performance Month-by-MonthOverview:
The 1A Monthly P&L Table is a straightforward yet powerful indicator / table designed to give you an immediate overview of the chart securities percentage performance on a monthly basis. Displayed conveniently in the bottom-right corner of your chart, this tool helps you quickly assess historical gains and losses, making it easier to analyze trends in performance over time.
Key Features:
- Monthly Performance at a Glance: Clearly see the percentage change for each past month.
- Cumulative P&L: A running total of the displayed monthly P&L is provided, giving you a quick sum of performance over the selected period.
[] Customizable Display:Months to Display: Choose how many past months you want to see in the table (from 1 to 36 months).
Text Size: Adjust the text size (Tiny, Small, Normal, Large, Huge) to fit your viewing preferences.
[] Text Color: Customize the color of the text for better visibility against your chart background. - Intraday & Daily Compatibility: The table is optimized to display on daily and intraday timeframes, ensuring it's relevant for various trading styles. (Note: For very long-term analysis on weekly/monthly charts, you might consider other tools, as this focuses on granular monthly P&L.)
How It Works:
The indicator calculates the percentage change from the close of the previous month to the close of the current month. For the very first month displayed, it calculates the P&L from the opening price of the chart's first bar to the close of that month. This data is then neatly organized into a table, updated on the last bar of the day or session.
Ideal For:
- Traders and investors who want a quick, visual summary of monthly performance.
- Analyzing seasonal trends or consistent periods of profitability.
Settings:
- Text Color: Changes the color of all text within the table.
- Text Size: Controls the font size of the table content.
- Months to Display: Determines the number of recent months included in the table.
Açık kaynak kodlu komut dosyası
Gerçek TradingView ruhuyla, bu komut dosyasının mimarı, yatırımcıların işlevselliğini inceleyip doğrulayabilmesi için onu açık kaynaklı hale getirdi. Yazarı tebrik ederiz! Ücretsiz olarak kullanabilseniz de, kodu yeniden yayınlamanın Topluluk Kurallarımıza tabi olduğunu unutmayın.
Feragatname
Bilgiler ve yayınlar, TradingView tarafından sağlanan veya onaylanan finansal, yatırım, alım satım veya diğer türden tavsiye veya öneriler anlamına gelmez ve teşkil etmez. Kullanım Koşulları bölümünde daha fazlasını okuyun.