KD_RSI345
Modified: 2/12/2017
Description:
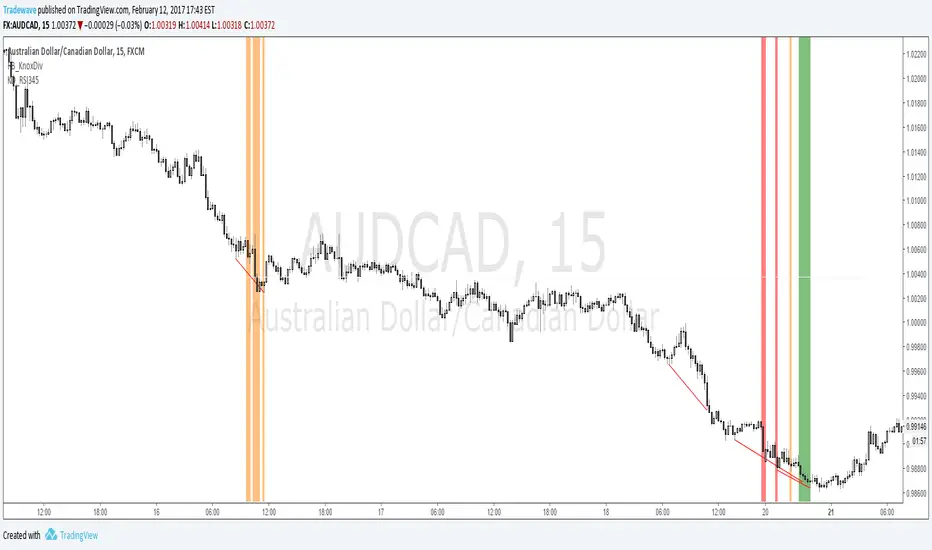
The indicator searches for instances where there is a Knoxville divergence combined with multiple time frame RSI Oversold/Overbought conditions.
When a bullish Knoxville Divergence (KD) is present and price is oversold across 3 time frames, within the KD bar range, a vertical green line is displayed on the chart.
When a bullish Knoxville Divergence (KD) is present and price is oversold across 4 time frames, within the KD bar range, a vertical orange line is displayed on the chart.
When a bullish Knoxville Divergence (KD) is present and price is oversold across 3 time frames, within the KD bar range, a vertical red line is displayed on the chart.
Same applies for Bearish Knoxville Divergence in overbought conditions.
Yalnızca davetli komut dosyası
Bu komut dosyasına yalnızca yazar tarafından onaylanan kullanıcılar erişebilir. Kullanmak için izin istemeniz ve almanız gerekir. Bu genellikle ödeme yapıldıktan sonra verilir. Daha fazla ayrıntı için aşağıdaki yazarın talimatlarını izleyin veya doğrudan LiquidityTracker ile iletişime geçin.
TradingView, yazarına tamamen güvenmediğiniz ve nasıl çalıştığını anlamadığınız sürece bir komut dosyası için ödeme yapmanızı veya kullanmanızı TAVSİYE ETMEZ. Ayrıca topluluk komut dosyalarımızda ücretsiz, açık kaynaklı alternatifler bulabilirsiniz.
Yazarın talimatları
Feragatname
Yalnızca davetli komut dosyası
Bu komut dosyasına yalnızca yazar tarafından onaylanan kullanıcılar erişebilir. Kullanmak için izin istemeniz ve almanız gerekir. Bu genellikle ödeme yapıldıktan sonra verilir. Daha fazla ayrıntı için aşağıdaki yazarın talimatlarını izleyin veya doğrudan LiquidityTracker ile iletişime geçin.
TradingView, yazarına tamamen güvenmediğiniz ve nasıl çalıştığını anlamadığınız sürece bir komut dosyası için ödeme yapmanızı veya kullanmanızı TAVSİYE ETMEZ. Ayrıca topluluk komut dosyalarımızda ücretsiz, açık kaynaklı alternatifler bulabilirsiniz.