OPEN-SOURCE SCRIPT
Crypto Heatmap [Pinescriptlabs]
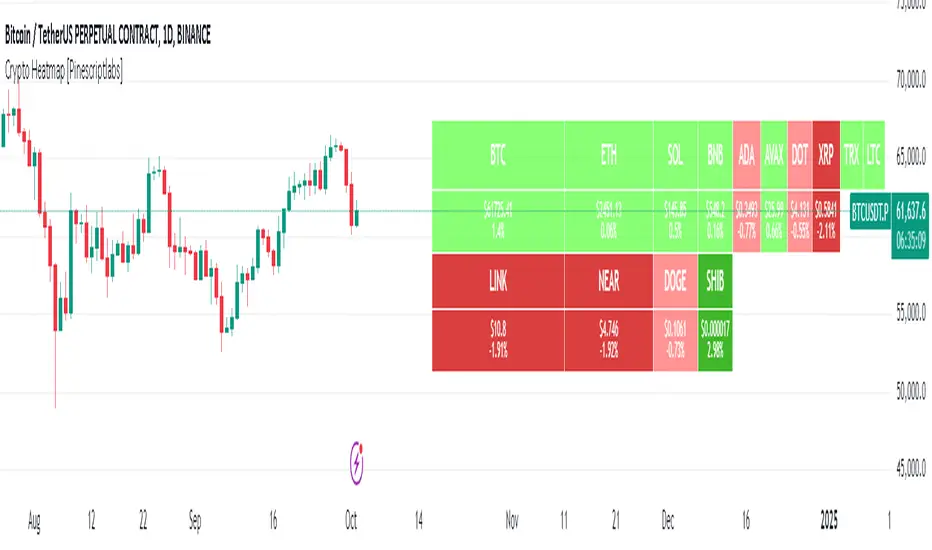
🌟 Crypto Heatmap is a visual tool that enables quick and efficient visualization of price behavior and percentage changes of various cryptocurrencies.
📊 It generates a heatmap to show variations in daily closing prices, helping traders quickly identify assets with the most movement.
📈 Percentage Change Calculation: It calculates the difference between the current price and the previous day's price, updating with each ticker.
✨ It uses a dynamic approach that adjusts colors based on market movements, making it easier to detect trading opportunities.
👀 You will notice for a moment that some cells disappear; this is because the table updates with each ticker to show real-time changes.

Español:
🌟 Crypto Heatmap es una herramienta visual que permite una rápida y eficiente visualización del comportamiento de precios y cambios porcentuales de varias criptomonedas.
📊 Genera un mapa de calor para mostrar las variaciones en los precios de cierre diario, ayudando a los traders a identificar rápidamente los activos con mayor movimiento.
📈 Cálculo del cambio porcentual: Calcula la diferencia entre el precio actual y el del día anterior, actualizándose en cada ticker.
✨ Utiliza un enfoque dinámico que ajusta los colores según los movimientos del mercado, facilitando la detección de oportunidades de trading.
Aquí tienes la traducción al español:
👀 **Observarás por un momento que algunas celdas desaparecen; esto es porque la tabla se actualiza en cada ticker para mostrar el cambio en tiempo real.**
📊 It generates a heatmap to show variations in daily closing prices, helping traders quickly identify assets with the most movement.
📈 Percentage Change Calculation: It calculates the difference between the current price and the previous day's price, updating with each ticker.
✨ It uses a dynamic approach that adjusts colors based on market movements, making it easier to detect trading opportunities.
👀 You will notice for a moment that some cells disappear; this is because the table updates with each ticker to show real-time changes.
Español:
🌟 Crypto Heatmap es una herramienta visual que permite una rápida y eficiente visualización del comportamiento de precios y cambios porcentuales de varias criptomonedas.
📊 Genera un mapa de calor para mostrar las variaciones en los precios de cierre diario, ayudando a los traders a identificar rápidamente los activos con mayor movimiento.
📈 Cálculo del cambio porcentual: Calcula la diferencia entre el precio actual y el del día anterior, actualizándose en cada ticker.
✨ Utiliza un enfoque dinámico que ajusta los colores según los movimientos del mercado, facilitando la detección de oportunidades de trading.
Aquí tienes la traducción al español:
👀 **Observarás por un momento que algunas celdas desaparecen; esto es porque la tabla se actualiza en cada ticker para mostrar el cambio en tiempo real.**
Açık kaynak kodlu komut dosyası
Gerçek TradingView ruhuyla, bu komut dosyasının mimarı, yatırımcıların işlevselliğini inceleyip doğrulayabilmesi için onu açık kaynaklı hale getirdi. Yazarı tebrik ederiz! Ücretsiz olarak kullanabilseniz de, kodu yeniden yayınlamanın Topluluk Kurallarımıza tabi olduğunu unutmayın.
Feragatname
Bilgiler ve yayınlar, TradingView tarafından sağlanan veya onaylanan finansal, yatırım, alım satım veya diğer türden tavsiye veya öneriler anlamına gelmez ve teşkil etmez. Kullanım Koşulları bölümünde daha fazlasını okuyun.