OPEN-SOURCE SCRIPT
Volume Volatality Indicator
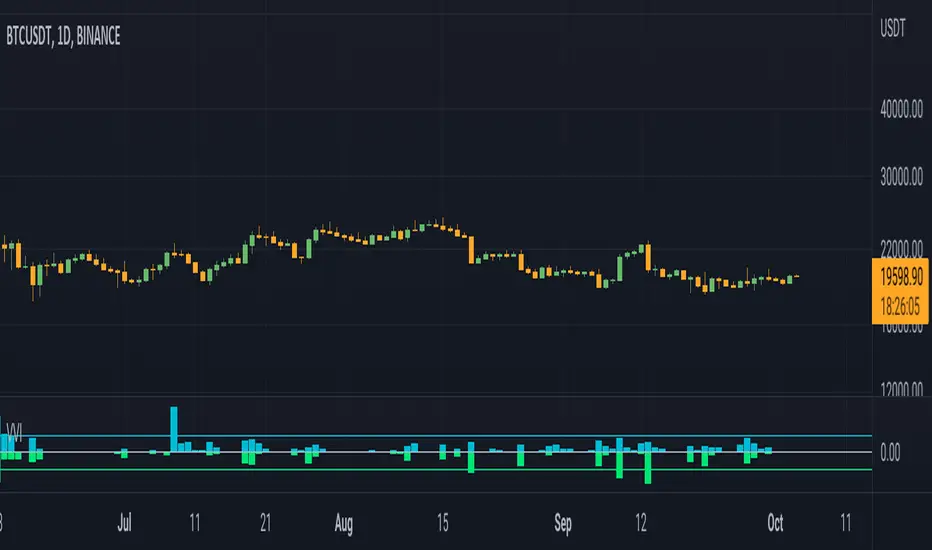
Volume Volatility Indicator
vol: volume; vma: rma of volume
Cyan column shows (vol - vma)/vma, if vol > vma else shows 0
0 value means vol less than vma: good for continuation
0 < value < 1 means vol more than vma: good for trend
value > 1 means vol more than 2 * vma: good for reversal
tr: truerange; atr: averagetruerange
Lime column show -(tr - atr)/atr, if tr > atr else show 0
0 value means tr less than atr: good for continuation
0 > value > -1 means tr more than atr: good for trend
value < -1 means tr more than 2 * atr: good for reversal
Cyan line = 1
Lime line = -1
This indicator shows the volume and truerange together.
Good for filtering trending and consolidating markets.
Thanks for the support.
Açık kaynak kodlu komut dosyası
Gerçek TradingView ruhuyla, bu komut dosyasının mimarı, yatırımcıların işlevselliğini inceleyip doğrulayabilmesi için onu açık kaynaklı hale getirdi. Yazarı tebrik ederiz! Ücretsiz olarak kullanabilseniz de, kodu yeniden yayınlamanın Topluluk Kurallarımıza tabi olduğunu unutmayın.
Feragatname
Bilgiler ve yayınlar, TradingView tarafından sağlanan veya onaylanan finansal, yatırım, alım satım veya diğer türden tavsiye veya öneriler anlamına gelmez ve teşkil etmez. Kullanım Koşulları bölümünde daha fazlasını okuyun.