PROTECTED SOURCE SCRIPT
ATH & ATL Distances PRO & Trend Lines
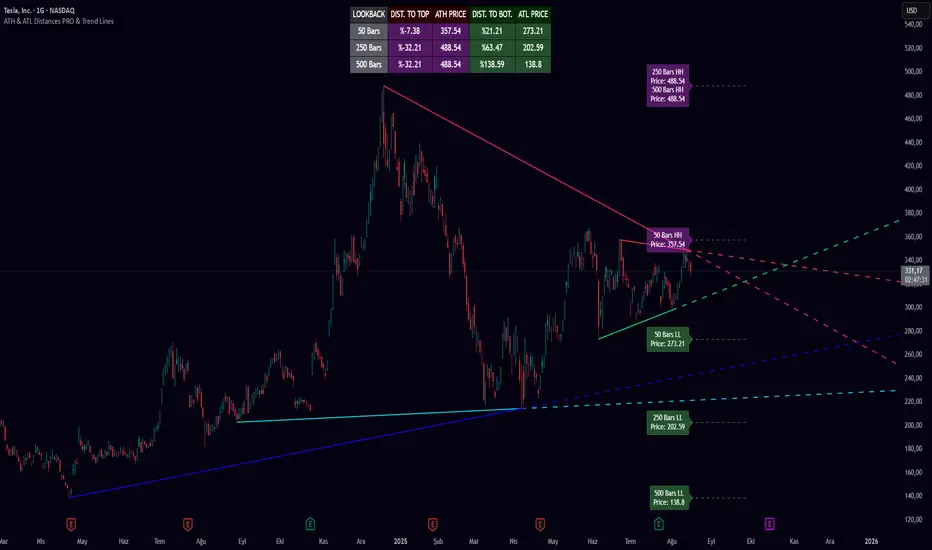
ATH & ATL Distances PRO with Trend Lines
Overview
This Pine Script™ v6 indicator is designed for traders seeking a comprehensive view of All-Time High (ATH) and All-Time Low (ATL) levels over customizable lookback periods.
It calculates percentage distances from the current close price to these key levels and displays them in a dynamic table.
Additionally, it draws horizontal lines for ATH/ATL with labels and introduces "unbroken" trend lines for resistance and support, helping identify potential trend continuations or reversals. Ideal for multi-timeframe analysis on stocks, forex, crypto, or any charted asset.
The script emphasizes user customization, allowing toggles for rows, groups, and visuals to suit various trading styles without cluttering the chart.
Key Features
ATH/ATL Distance Calculations: Computes distances to the highest high (HH) and lowest low (LL) over three user-defined lookback periods (default: 50, 150, 250 bars).
Distances are shown as percentages in a configurable table, with color-coded cells for quick visual assessment (e.g., red for ATH distances, green for ATL).
Dynamic Table Display: A customizable table positioned at your choice (e.g., top-center) with columns for Lookback, Dist. to Top, ATH Price, Dist. to Bot., and ATL Price. Rows can be individually shown/hidden for focused analysis.
Horizontal ATH/ATL Lines: Optional dashed lines extending a user-set length (default: 30 bars) with labels showing bar count, HH/LL designation, and price. Labels stack intelligently if multiple levels coincide.
Unbroken Trend Lines: A unique feature that draws resistance (descending) and support (ascending) trend lines connecting the primary HH/LL to the nearest "unbroken" secondary high/low within the lookback. "Unbroken" means the line hasn't been pierced by price action after the second point.
Divided into 3 groups (one per lookback), each with independent on/off toggles and colors.
Solid lines for historical segments, dashed extensions for future projections.
Resistance lines only draw if descending (y2 <= y1); support if ascending (y2 >= y1) to ensure logical trends.
Extensive Customization:Lookback periods (1-1000 bars).
Visibility toggles for lines, trends, and individual groups/rows.
Colors for every element: table headers/rows, lines, labels, and trend groups.
Table position options: top/bottom with left/right/center alignment.
How to Use
Add to Chart: Search for "ATH & ATL Distances PRO with Trend Lines" in TradingView's indicator library and add it to your chart.
Customize Settings:Lookback Periods: Adjust Lookback 1/2/3 for short/medium/long-term analysis (e.g., 50 for recent swings, 250 for broader trends).
Show ATH & ATL Lines: Toggle to display horizontal lines and labels. Set Line Length for how far they extend rightward.
Show Trend Lines: Enable to activate unbroken trends. Use group toggles (Show Group 1/2/3) to focus on specific lookbacks.
Table Options: Choose position and show/hide rows to declutter. Customize colors for better visibility on light/dark charts.
Interpretation:
Table: Negative Dist. to Top means price is below ATH (potential upside); positive Dist. to Bot. means above ATL (downside risk).
Trend Lines: Look for price interactions—bounces off support or breaks through resistance.
The "unbroken" logic selects the closest valid secondary point, ensuring relevance.
On Chart: Hover over labels for details. Trends extend dashed to project future levels.
Best Practices:Use on higher timeframes (e.g., daily) for major levels; lower for intraday.
Combine with other indicators like RSI or moving averages for confirmation.
Note: Calculations are based on historical highs/lows within the lookback—adjust for volatile assets to avoid noise.
Subtleties and Advanced Notes
Unbroken Logic: For resistance, it scans sorted secondary highs (excluding the primary HH) and picks the first unbroken candidate where no high pierces the line post-second point. Similarly for support with lows. If no valid point is found, no line draws—ensuring only reliable trends appear.
Performance Considerations: High lookback values (e.g., 1000) may increase computation time on long charts, but the script is optimized with array sorting for efficiency.
Edge Cases: If lookback exceeds available bars, it caps at chart history. Flat trends (y1 == y2) may draw as horizontal, overlapping ATH lines—toggle groups to manage.
Limitations: Trends are based on close-bar data; intra-bar extremes aren't considered. No alerts built-in—use TradingView's alert system on price crosses.
This indicator is built for educational and analytical purposes. Always backtest and combine with your strategy. Feedback welcome—happy trading!
Korumalı komut dosyası
Bu komut dosyası kapalı kaynak olarak yayınlanmaktadır. Ancak, özgürce ve herhangi bir sınırlama olmaksızın kullanabilirsiniz – daha fazla bilgi burada.
Feragatname
Bilgiler ve yayınlar, TradingView tarafından sağlanan veya onaylanan finansal, yatırım, işlem veya diğer türden tavsiye veya tavsiyeler anlamına gelmez ve teşkil etmez. Kullanım Şartları'nda daha fazlasını okuyun.