PROTECTED SOURCE SCRIPT
Price Range Deviation
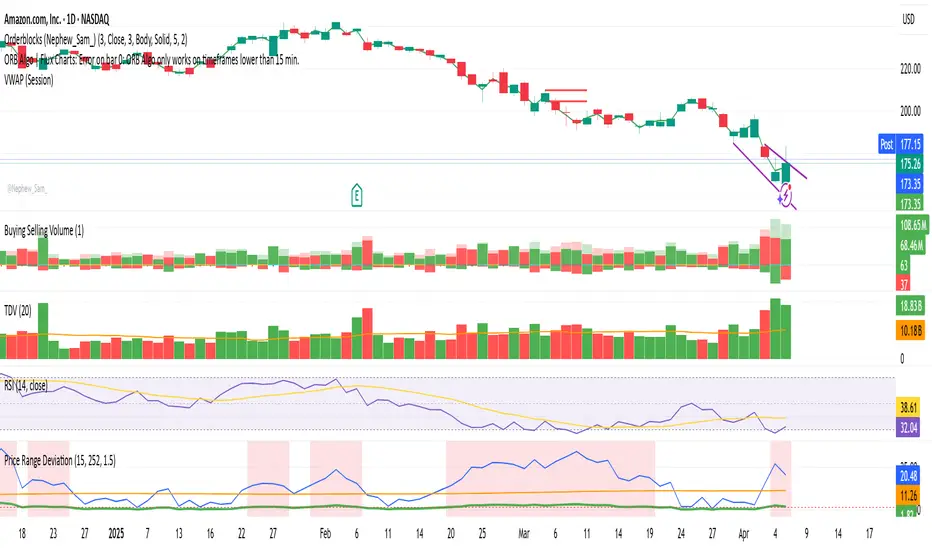
📌 Description: Price Range Deviation Indicator
This indicator measures how much a stock has moved over a recent period (e.g., 15 days) and compares that move to the average move of similar-length windows over a longer lookback period (e.g., 1 year or 252 days).
It helps identify when a stock has made an unusually large move compared to its historical norm — which can signal that the move is overextended.
📊 How It Works:
Recent Move ($): The absolute price change over the selected recent period.
Average Move ($): The average absolute price change over rolling windows of the same size across the full lookback period.
Move Ratio: The current move divided by the average move.
When the move ratio exceeds a custom threshold (e.g., 1.5× the average), the background highlights red to signal that the move is unusually large.
💡 Use Case:
Ideal for options traders looking to:
Identify overextended price moves
Sell out-of-the-money calls or puts beyond a high-move zone
Fade price exhaustion with high probability setups
Korumalı komut dosyası
Bu komut dosyası kapalı kaynak olarak yayınlanmaktadır. Ancak, ücretsiz ve herhangi bir sınırlama olmaksızın kullanabilirsiniz – daha fazla bilgiyi buradan edinebilirsiniz.
Feragatname
Bilgiler ve yayınlar, TradingView tarafından sağlanan veya onaylanan finansal, yatırım, alım satım veya diğer türden tavsiye veya öneriler anlamına gelmez ve teşkil etmez. Kullanım Koşulları bölümünde daha fazlasını okuyun.