OPEN-SOURCE SCRIPT
Güncellendi Bollinger Band Volatility Spread Visualizer
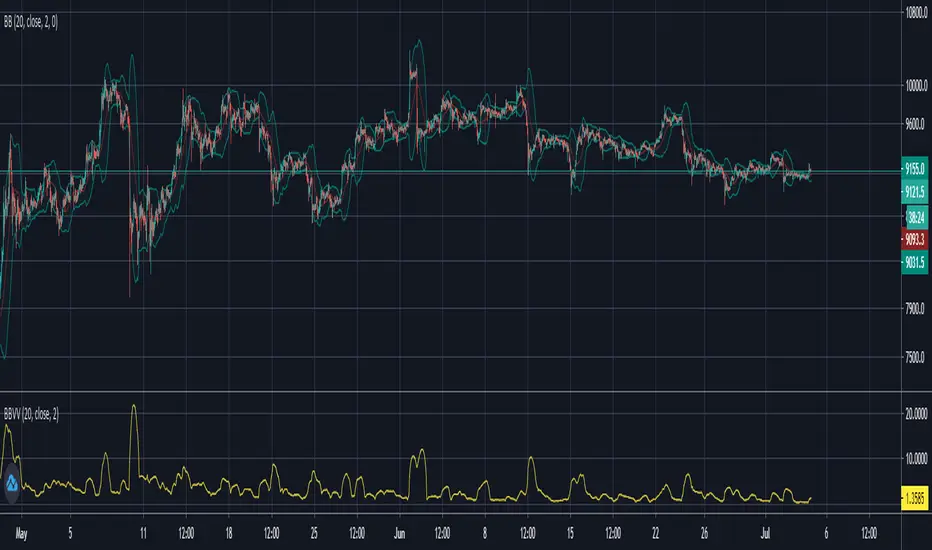
This indicator was created to see the total dollar (or whatever currency pair) amount spread between the upper and lower Bollinger Bands. This knowledge of knowing this spread can be used to indicate upcoming periods of high volatility in a market. The fundamental idea behind predicting periods of high volatility is backed up by the idea that periods of low volatility are followed by periods of high volatility and vice versa.
Based on this knowledge, the numerical spread of the Bollinger Bands, as shown in the indicator, we can deduce that when the value is super low, we can expect a period of high volatility AKA: big move incoming.
This indicator is not fully finished because this was my first time coding in Pinescript and I wanted to post the basic indicator first.
My future plans for improving this indicator include:
- Adding customization as an option to choose your personal BBands settings that this indicator is based off of
- Potentially converting this indicator as a TradingView Strategy where a signal would go off when the spread reaches a certain threshold
Sürüm Notları
Added code for custom Bollinger Bands input for flexibility for everyone's different uses of Bollinger BandsSürüm Notları
Changed the way the data is presented by indexing the spread of the Bollinger Bands relative to the price of the asset. Basically just used the Bollinger Bands Width function that already exists and multiplied by 100 to get more precision. My eventual goal is to figure out a threshold that when reached, creates a general signal of upcoming high volatility. That signal can then be used in conjunction with other indicators (to detect the direction of a trend) to create a buy or sell signal.
Açık kaynak kodlu komut dosyası
Gerçek TradingView ruhuyla, bu komut dosyasının mimarı, yatırımcıların işlevselliğini inceleyip doğrulayabilmesi için onu açık kaynaklı hale getirdi. Yazarı tebrik ederiz! Ücretsiz olarak kullanabilseniz de, kodu yeniden yayınlamanın Topluluk Kurallarımıza tabi olduğunu unutmayın.
Feragatname
Bilgiler ve yayınlar, TradingView tarafından sağlanan veya onaylanan finansal, yatırım, alım satım veya diğer türden tavsiye veya öneriler anlamına gelmez ve teşkil etmez. Kullanım Koşulları bölümünde daha fazlasını okuyun.