OPEN-SOURCE SCRIPT
Stochastic Momentum Index _ UCSgears
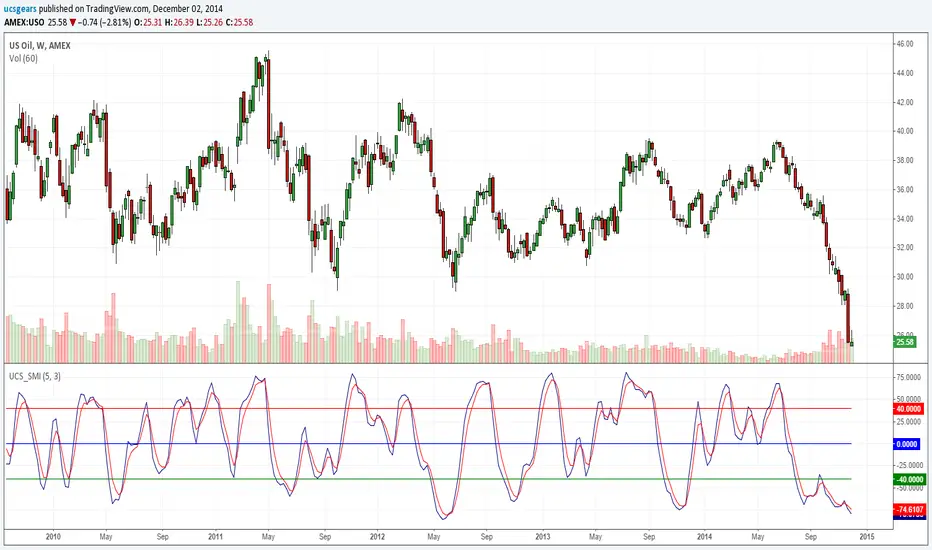
The Stochastic Momentum Index (SMI) was introduced by William Blau in 1993 as a way to clarify the traditional stochastic oscillator. SMI helps you see where the current close has taken place relative to the midpoint of the recent high to low range is based on price change in relation to the range of the price. This is a range based indicator, when used right. It can help momentum changes.
For those looking for help understanding this -
wiki.timetotrade.eu/Stochastic_Momentum_Index
tradingstrategyideas.com/entries/stochastic-momentum-index/
tlc.thinkorswim.com/center/charting/studies/studies-library/R-S/StochasticMomentumIndex.html
sierrachart.com/supportboard/attachment.php?attachmentid=4714&d=1277899234
Açık kaynak kodlu komut dosyası
Gerçek TradingView ruhuna uygun olarak, bu komut dosyasının oluşturucusu bunu açık kaynaklı hale getirmiştir, böylece yatırımcılar betiğin işlevselliğini inceleyip doğrulayabilir. Yazara saygı! Ücretsiz olarak kullanabilirsiniz, ancak kodu yeniden yayınlamanın Site Kurallarımıza tabi olduğunu unutmayın.
Uday C Santhakumar
Feragatname
Bilgiler ve yayınlar, TradingView tarafından sağlanan veya onaylanan finansal, yatırım, işlem veya diğer türden tavsiye veya tavsiyeler anlamına gelmez ve teşkil etmez. Kullanım Şartları'nda daha fazlasını okuyun.