OPEN-SOURCE SCRIPT
Güncellendi Multi Candle Body Mapper
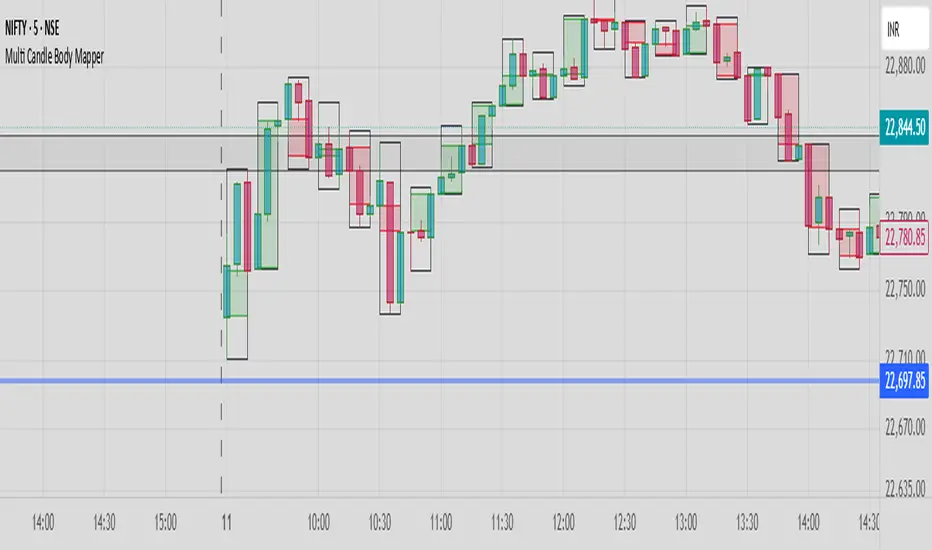
Multi Candle Body Mapper
Visualize higher-timeframe candle structure within lower timeframes — without switching charts.
This tool maps grouped candle bodies and wicks (e.g., 15min candles on a 5min chart) using precise boxes and lines. Ideal for intraday traders who want to analyze market intent, body bias, and wick rejection in a compressed, organized view.
Features:
Visualize 3, 6, or 12 candle groups (e.g., 15min / 30min / 1H views)
Body box shows bullish/bearish color with adjustable transparency
Wick box shows high-low range with adjustable thickness and color
Dashed line at group close level for market direction hint
Full color customization
Toggle individual elements ON/OFF
Clean overlay – doesn’t interfere with price candles
Great for spotting:
Hidden support/resistance
Momentum buildup
Reversal traps and continuation setups
Keep your chart simple but smarter — all without changing your timeframe.
Sürüm Notları
Multi Candle Body MapperVisualize higher-timeframe candle structure within lower timeframes — without switching charts.
This tool maps grouped candle bodies and wicks (e.g., 15min candles on a 5min chart) using precise boxes and lines. Ideal for intraday traders who want to analyze market intent, body bias, and wick rejection in a compressed, organized view.
Features:
Visualize 3, 6, or 12 candle groups (e.g., 15min / 30min / 1H views)
Body box shows bullish/bearish color with adjustable transparency
Wick box shows high-low range with adjustable thickness and color
Dashed line at group close level for market direction hint
Full color customization
Toggle individual elements ON/OFF
Clean overlay – doesn’t interfere with price candles
Great for spotting:
Hidden support/resistance
Momentum buildup
Reversal traps and continuation setups
Keep your chart simple but smarter — all without changing your timeframe.
Açık kaynak kodlu komut dosyası
Gerçek TradingView ruhuyla, bu komut dosyasının mimarı, yatırımcıların işlevselliğini inceleyip doğrulayabilmesi için onu açık kaynaklı hale getirdi. Yazarı tebrik ederiz! Ücretsiz olarak kullanabilseniz de, kodu yeniden yayınlamanın Topluluk Kurallarımıza tabi olduğunu unutmayın.
Feragatname
Bilgiler ve yayınlar, TradingView tarafından sağlanan veya onaylanan finansal, yatırım, alım satım veya diğer türden tavsiye veya öneriler anlamına gelmez ve teşkil etmez. Kullanım Koşulları bölümünde daha fazlasını okuyun.