OPEN-SOURCE SCRIPT
Güncellendi MTF Swing Highs and Lows w/ Supply and Demand Zones
I designed this indicator out of necessity for the Market structure/Price action trading strategy I use.
I thought I'd share. :)
For the fans of my Multi Timeframe Swing High and Low indicator, I have added Supply and Demand Zones!
The Supply and Demand Zones are based on the Swing Highs and Lows of my MTF Swing Highs and Lows Indicator.
The S/D Zones are created on the wicks of the Swing Highs and Lows.
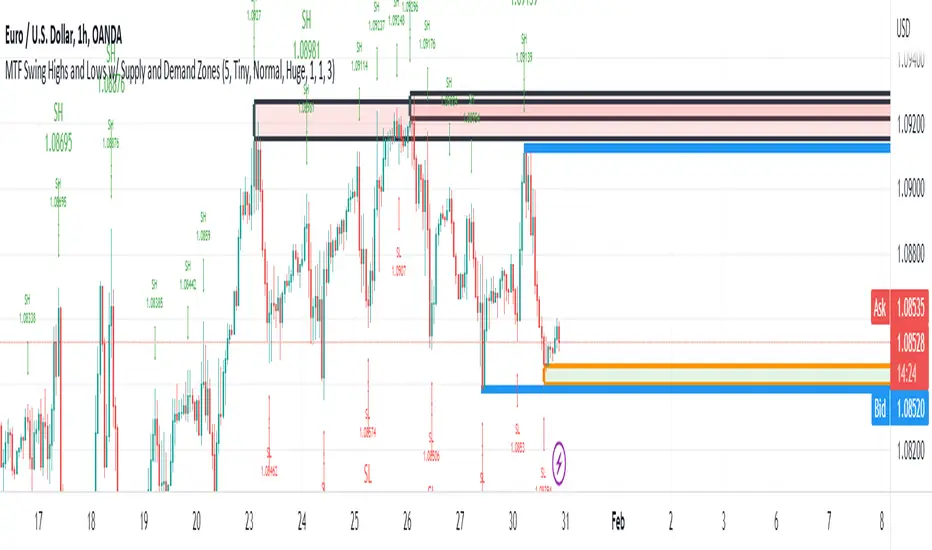
You can choose whether to display the Chart, Higher and/or Highest timeframes as in the chart below.
You can also choose to display up to 3 S/D Zones from the past 3 Swing Highs and Lows.
The default setting is to display 1 chart timeframe S/D Zone, 2 higher and 3 highest, as I found this to be most effective without
cluttering the screen too much
The Chart Timeframe S/D Zones have an orange border, higher timeframe have a blue border and the highest have a black border.
Supply zones based on Swing Highs are red and Demand Zones based on Swing Lows are green.
This indicator displays Swing Highs and Lows on 3 timeframes based on the Chart timeframe, as follows:
Chart TF Higher TF Highest TF
1m 5m 15m
5m 15m 60m
15m 60m 240m
60m 240m Daily
240m Daily Weekly
Daily Weekly Monthly
You can change the font size of the labels as you'd prefer.
I thought I'd share. :)
For the fans of my Multi Timeframe Swing High and Low indicator, I have added Supply and Demand Zones!
The Supply and Demand Zones are based on the Swing Highs and Lows of my MTF Swing Highs and Lows Indicator.
The S/D Zones are created on the wicks of the Swing Highs and Lows.
You can choose whether to display the Chart, Higher and/or Highest timeframes as in the chart below.
You can also choose to display up to 3 S/D Zones from the past 3 Swing Highs and Lows.
The default setting is to display 1 chart timeframe S/D Zone, 2 higher and 3 highest, as I found this to be most effective without
cluttering the screen too much
The Chart Timeframe S/D Zones have an orange border, higher timeframe have a blue border and the highest have a black border.
Supply zones based on Swing Highs are red and Demand Zones based on Swing Lows are green.
This indicator displays Swing Highs and Lows on 3 timeframes based on the Chart timeframe, as follows:
Chart TF Higher TF Highest TF
1m 5m 15m
5m 15m 60m
15m 60m 240m
60m 240m Daily
240m Daily Weekly
Daily Weekly Monthly
You can change the font size of the labels as you'd prefer.
Sürüm Notları
ADDITION: Added option to extend zones leftSürüm Notları
Modification:I have altered the code and options to be able to turn on and off individual supply and demand zones so as to eliminate ones that may be exhausted or cluttering the screen.
Açık kaynak kodlu komut dosyası
Gerçek TradingView ruhuyla, bu komut dosyasının yaratıcısı, yatırımcıların işlevselliğini inceleyip doğrulayabilmesi için onu açık kaynaklı hale getirdi. Yazarı tebrik ederiz! Ücretsiz olarak kullanabilseniz de, kodu yeniden yayınlamanın Topluluk Kurallarımıza tabi olduğunu unutmayın.
Feragatname
Bilgiler ve yayınlar, TradingView tarafından sağlanan veya onaylanan finansal, yatırım, alım satım veya diğer türden tavsiye veya öneriler anlamına gelmez ve teşkil etmez. Kullanım Koşulları bölümünde daha fazlasını okuyun.