OPEN-SOURCE SCRIPT
Pearson vs Approx. Spearman Correlation
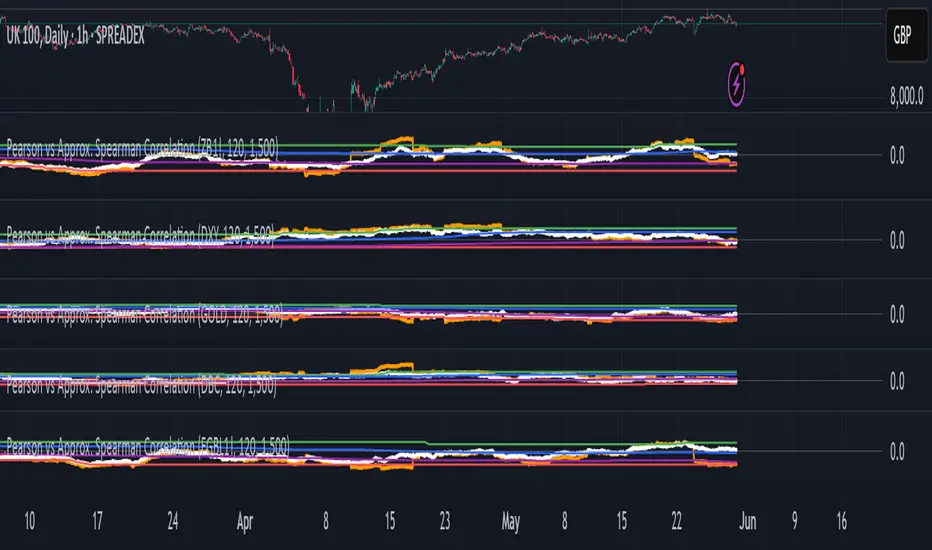
This indicator displays the rolling Pearson and approximate Spearman correlation between the chart's asset and a second user-defined asset, based on log returns over a customizable window.
Features:
- Pearson correlation of log returns (standard linear dependency measure)
- Approximate Spearman correlation, using percentile ranks to better capture nonlinear and monotonic relationships
/ Horizontal lines showing:
Maximum and minimum correlation values over a statistical window
1st quartile (25%) and 3rd quartile (75%) — helpful for identifying statistically high or low regimes
This script is useful for identifying dynamic co-movements, regime changes, or correlation breakdowns between assets — applicable in risk management, portfolio construction, and pairs trading strategies.
Açık kaynak kodlu komut dosyası
Gerçek TradingView ruhuyla, bu komut dosyasının mimarı, yatırımcıların işlevselliğini inceleyip doğrulayabilmesi için onu açık kaynaklı hale getirdi. Yazarı tebrik ederiz! Ücretsiz olarak kullanabilseniz de, kodu yeniden yayınlamanın Topluluk Kurallarımıza tabi olduğunu unutmayın.
Feragatname
Bilgiler ve yayınlar, TradingView tarafından sağlanan veya onaylanan finansal, yatırım, alım satım veya diğer türden tavsiye veya öneriler anlamına gelmez ve teşkil etmez. Kullanım Koşulları bölümünde daha fazlasını okuyun.