OPEN-SOURCE SCRIPT
Güncellendi Correlations P/L Range (in percent)
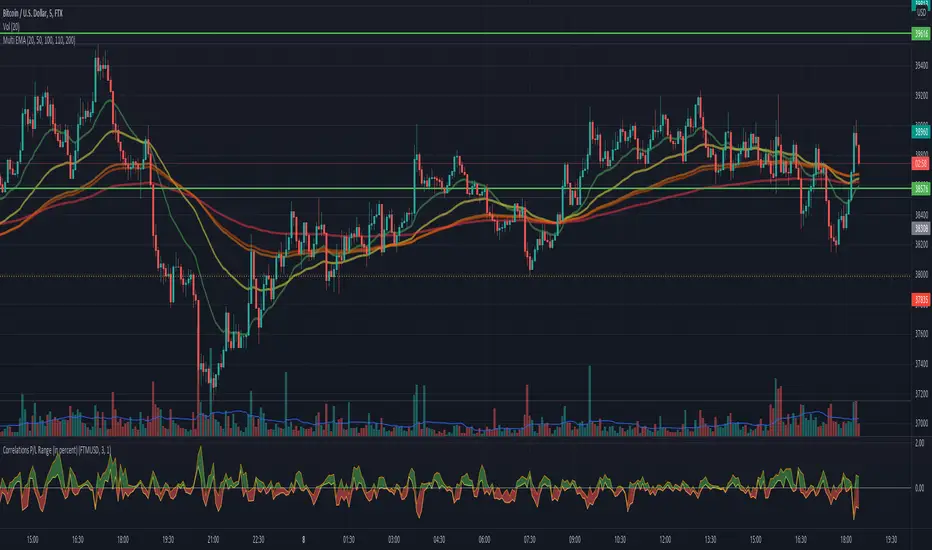
This script shows the inefficiency of the markets.
Comparing two (correlated) symbols, the values above 0 means the main symbol (at the top of the graph)
outperforms the other. A value below 0 means the main symbol underperforms the other.
The band displays different entries until the last candle. Any P/L (of the band range)
is visible in the band. Example: given a band range length of 5, then all last 5 values
are compares with the current value for both symbols. Or in other words:
If symbol A, lets say ETHUSD outperforms, lets say BITCOIN (the main symbol), in the last
5 candles, then we would see all values of the band are negative.
Any question, comment or improvements are welcome.
Sürüm Notları
see description of the scriptAçık kaynak kodlu komut dosyası
Gerçek TradingView ruhuyla, bu komut dosyasının mimarı, yatırımcıların işlevselliğini inceleyip doğrulayabilmesi için onu açık kaynaklı hale getirdi. Yazarı tebrik ederiz! Ücretsiz olarak kullanabilseniz de, kodu yeniden yayınlamanın Topluluk Kurallarımıza tabi olduğunu unutmayın.
Feragatname
Bilgiler ve yayınlar, TradingView tarafından sağlanan veya onaylanan finansal, yatırım, alım satım veya diğer türden tavsiye veya öneriler anlamına gelmez ve teşkil etmez. Kullanım Koşulları bölümünde daha fazlasını okuyun.
Açık kaynak kodlu komut dosyası
Gerçek TradingView ruhuyla, bu komut dosyasının mimarı, yatırımcıların işlevselliğini inceleyip doğrulayabilmesi için onu açık kaynaklı hale getirdi. Yazarı tebrik ederiz! Ücretsiz olarak kullanabilseniz de, kodu yeniden yayınlamanın Topluluk Kurallarımıza tabi olduğunu unutmayın.
Feragatname
Bilgiler ve yayınlar, TradingView tarafından sağlanan veya onaylanan finansal, yatırım, alım satım veya diğer türden tavsiye veya öneriler anlamına gelmez ve teşkil etmez. Kullanım Koşulları bölümünde daha fazlasını okuyun.