PROTECTED SOURCE SCRIPT
Güncellendi MG Support Resistance barriers with Gann and Moving Avg V1
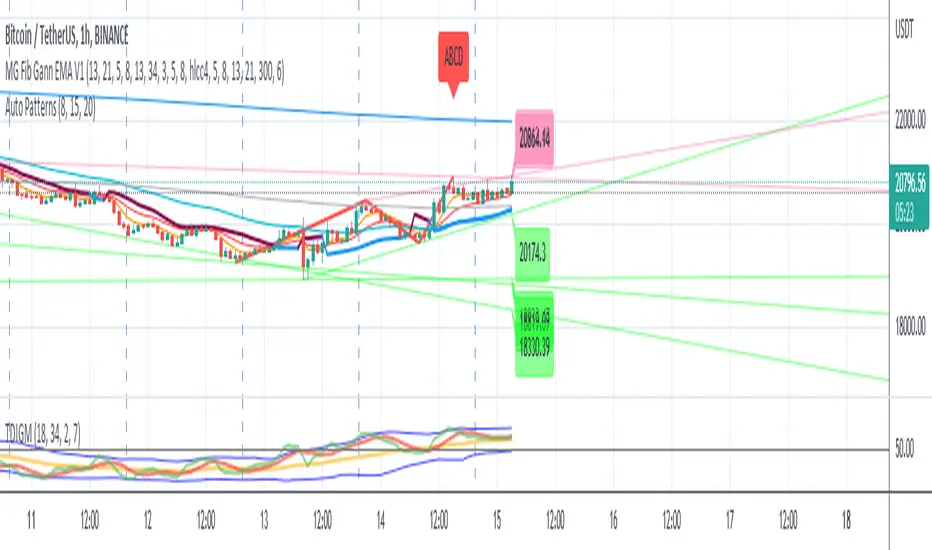
This script has multiple indicators:-
1. It uses past 3 days highs and lows to prediction critical support and resistance zones. - the zone is Green and red are the areas where one can observe that retrace happens and ones there is a breakout then gone up or down.
2. It also has a Gann line which gives a trend signal
3. Based on Moving averages it optionally plots the high low channel (haven't seen much use of it for most stocks I tried so far.
4. It also have EMA fast and slow to show the additional trend
5. Also can plot alligator trend. gives a good trend for FX trading at 2 or 3 mins intervals.
This is version 1 based on many existing scripts combined in 1 with some improvements.
Sürüm Notları
added many more inddicators.Korumalı komut dosyası
Bu komut dosyası kapalı kaynak olarak yayınlanmaktadır. Ancak, özgürce ve herhangi bir sınırlama olmaksızın kullanabilirsiniz – daha fazla bilgi burada.
Feragatname
Bilgiler ve yayınlar, TradingView tarafından sağlanan veya onaylanan finansal, yatırım, işlem veya diğer türden tavsiye veya tavsiyeler anlamına gelmez ve teşkil etmez. Kullanım Şartları'nda daha fazlasını okuyun.
Korumalı komut dosyası
Bu komut dosyası kapalı kaynak olarak yayınlanmaktadır. Ancak, özgürce ve herhangi bir sınırlama olmaksızın kullanabilirsiniz – daha fazla bilgi burada.
Feragatname
Bilgiler ve yayınlar, TradingView tarafından sağlanan veya onaylanan finansal, yatırım, işlem veya diğer türden tavsiye veya tavsiyeler anlamına gelmez ve teşkil etmez. Kullanım Şartları'nda daha fazlasını okuyun.