OPEN-SOURCE SCRIPT
Relative Performance Dashboard v. 2
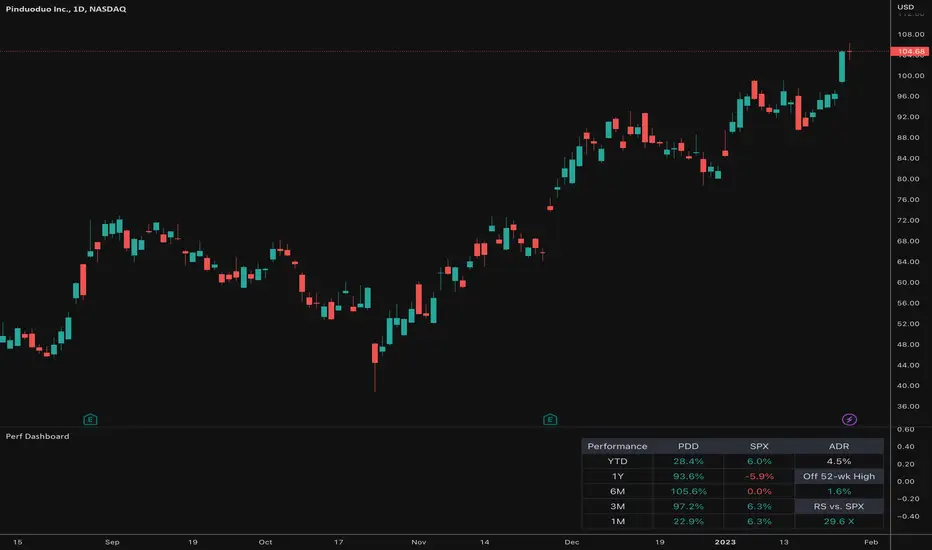
This is a smaller and cleaner version of my previous Relative Performance table. It looks at the rate of change over 1M, 3M, 6M, 1YR & YTD and displays those for the current chart's ticker vs. an index/ticker of your choosing (SPX is default). I also have some fields for the ADR of the displayed chart, how far away the displayed chart is from 52-week highs, and a single number that compares the average relative strength of the displayed chart vs. the index. The way this average calculates is customizable by the user.
I like using this table next to an Earnings/Sales/Volume table that already exists by another user in the same pane and I designed this one so it can look just like that one to give a great view of the both fundamental and technical strength of your ticker in the same pane.
Keeping fundamental data independent from performance data allows you to still be able to see performance on things without fundamental data (i.e. ETFs, Indices, Crypto, etc.) as any script that uses fundamental data will not display when a chart that does not have fundamental data is displayed.
Açık kaynak kodlu komut dosyası
Gerçek TradingView ruhuna uygun olarak, bu komut dosyasının oluşturucusu bunu açık kaynaklı hale getirmiştir, böylece yatırımcılar betiğin işlevselliğini inceleyip doğrulayabilir. Yazara saygı! Ücretsiz olarak kullanabilirsiniz, ancak kodu yeniden yayınlamanın Site Kurallarımıza tabi olduğunu unutmayın.
Feragatname
Bilgiler ve yayınlar, TradingView tarafından sağlanan veya onaylanan finansal, yatırım, işlem veya diğer türden tavsiye veya tavsiyeler anlamına gelmez ve teşkil etmez. Kullanım Şartları'nda daha fazlasını okuyun.