PROTECTED SOURCE SCRIPT
RSI-Two.4
This looks like a detailed breakdown of a custom trading indicator based on the RSI (Relative Strength Index). It integrates various sub-indicators and visual analysis tools to precisely identify market strength and trend reversal signals.
Here is the English version of the provided text.
Overview
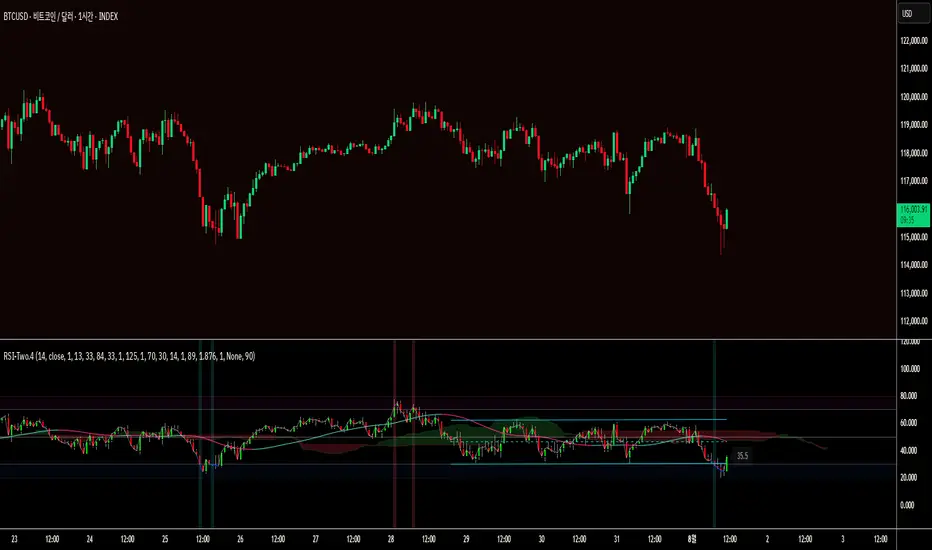
This indicator is designed to precisely identify market strength and trend reversal signals by integrating various sub-indicators and visual analysis tools centered around the RSI (Relative Strength Index).
On the chart, you can grasp the RSI trend, overbought/oversold zones, divergences, and trend reversal signals all at once, enabling more reliable trading decisions.
Detailed Feature Analysis
1. Basic RSI Calculation and Visualization
RSI Calculation:
Instead of the traditional RSI formula, a smoothed moving average method using ta.rma() is employed to reduce noise and provide a more intuitive RSI value.
Line Color and Display:
The RSI line is displayed in blue (#0B54FE) when the value is below 30, pink (#FC0FC0) when it's above 70, and semi-transparent white otherwise. This provides a clear, intuitive distinction of overbought and oversold zones.
Adjustable Line Thickness:
You can adjust the line thickness for customized chart readability.
2. RSI Candle Chart
Purpose:
The visual flow of the RSI is displayed in a candle chart format, allowing you to grasp the RSI's upward/downward trend at a glance.
Application:
Rising candles are shown in transparent green, while falling candles are shown in transparent red, allowing for an immediate assessment of market strength.
Utility:
This is far more intuitive than a regular RSI line and, when viewed alongside the main candle chart, helps you quickly recognize market turning points.
3. Ichimoku Cloud (RSI-based)
Cloud Concept:
This feature borrows the principles of the traditional Ichimoku Cloud to form an RSI-based cloud.
Leading Spans A and B:
The leading spans are calculated using the RSI's conversion and base lines, visualizing market support and resistance zones.
Colors:
Upward clouds are green, and downward clouds are brown.
How to Use:
Quickly identify bullish/bearish zones based on the cloud's color and position. A breakthrough of the cloud can be used as a strong trend reversal signal.
4. v.h.m. Moving Average Trend Length (Self-Calculated)
Color Change:
The color changes to green when the RSI rises and to pink when it falls, providing an intuitive grasp of the trend's direction.
Expert Tip:
A strong buy signal can be generated when the HMA (Hull Moving Average) turns upward, and a sell signal when it turns downward.
5. Overbought/Oversold Vertical Lines
Levels:
Based on the 70 (overbought) and 30 (oversold) thresholds.
Signals:
When the RSI crosses above 70 or below 30, colored vertical lines appear in the chart's background, quickly signaling an overbought or oversold state.
Expert Application:
Use overbought zones to identify potential selling opportunities and oversold zones to spot potential buying opportunities.
6. Divergence Detection
Function:
The indicator automatically detects bullish and bearish divergences, as well as hidden divergences, by analyzing the difference between price peaks and troughs and the RSI.
Signals:
Labels with "D," circles, or arrows are displayed on the chart to predict a trend reversal or weakening of momentum.
Here is the English version of the provided text.
Overview
This indicator is designed to precisely identify market strength and trend reversal signals by integrating various sub-indicators and visual analysis tools centered around the RSI (Relative Strength Index).
On the chart, you can grasp the RSI trend, overbought/oversold zones, divergences, and trend reversal signals all at once, enabling more reliable trading decisions.
Detailed Feature Analysis
1. Basic RSI Calculation and Visualization
RSI Calculation:
Instead of the traditional RSI formula, a smoothed moving average method using ta.rma() is employed to reduce noise and provide a more intuitive RSI value.
Line Color and Display:
The RSI line is displayed in blue (#0B54FE) when the value is below 30, pink (#FC0FC0) when it's above 70, and semi-transparent white otherwise. This provides a clear, intuitive distinction of overbought and oversold zones.
Adjustable Line Thickness:
You can adjust the line thickness for customized chart readability.
2. RSI Candle Chart
Purpose:
The visual flow of the RSI is displayed in a candle chart format, allowing you to grasp the RSI's upward/downward trend at a glance.
Application:
Rising candles are shown in transparent green, while falling candles are shown in transparent red, allowing for an immediate assessment of market strength.
Utility:
This is far more intuitive than a regular RSI line and, when viewed alongside the main candle chart, helps you quickly recognize market turning points.
3. Ichimoku Cloud (RSI-based)
Cloud Concept:
This feature borrows the principles of the traditional Ichimoku Cloud to form an RSI-based cloud.
Leading Spans A and B:
The leading spans are calculated using the RSI's conversion and base lines, visualizing market support and resistance zones.
Colors:
Upward clouds are green, and downward clouds are brown.
How to Use:
Quickly identify bullish/bearish zones based on the cloud's color and position. A breakthrough of the cloud can be used as a strong trend reversal signal.
4. v.h.m. Moving Average Trend Length (Self-Calculated)
Color Change:
The color changes to green when the RSI rises and to pink when it falls, providing an intuitive grasp of the trend's direction.
Expert Tip:
A strong buy signal can be generated when the HMA (Hull Moving Average) turns upward, and a sell signal when it turns downward.
5. Overbought/Oversold Vertical Lines
Levels:
Based on the 70 (overbought) and 30 (oversold) thresholds.
Signals:
When the RSI crosses above 70 or below 30, colored vertical lines appear in the chart's background, quickly signaling an overbought or oversold state.
Expert Application:
Use overbought zones to identify potential selling opportunities and oversold zones to spot potential buying opportunities.
6. Divergence Detection
Function:
The indicator automatically detects bullish and bearish divergences, as well as hidden divergences, by analyzing the difference between price peaks and troughs and the RSI.
Signals:
Labels with "D," circles, or arrows are displayed on the chart to predict a trend reversal or weakening of momentum.
Korumalı komut dosyası
Bu komut dosyası kapalı kaynak olarak yayınlanmaktadır. Ancak, ücretsiz ve herhangi bir sınırlama olmaksızın kullanabilirsiniz – daha fazla bilgiyi buradan edinebilirsiniz.
Feragatname
Bilgiler ve yayınlar, TradingView tarafından sağlanan veya onaylanan finansal, yatırım, alım satım veya diğer türden tavsiye veya öneriler anlamına gelmez ve teşkil etmez. Kullanım Koşulları bölümünde daha fazlasını okuyun.