OPEN-SOURCE SCRIPT
Güncellendi Horizontal Lines from Current Price
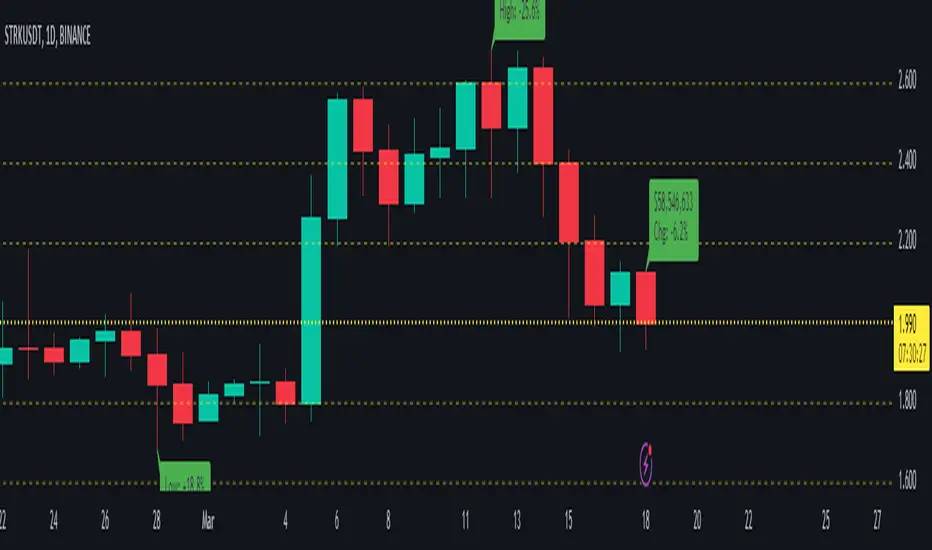
This indicator will help traders track price fluctuations in smaller time frames more conveniently than ever before.
Here's how it works:
Additionally, we also provide volume display (measured in USD) at the current candle position to assist traders in keeping track of market momentum more closely.
Installation guide for indicators:
Here's how it works:
Starting from the current price, the indicator will draw horizontal lines spaced 10% apart.
Now, whenever zooming in or out of the chart, traders can visually determine the level of price volatility more easily.
Additionally, we also provide volume display (measured in USD) at the current candle position to assist traders in keeping track of market momentum more closely.
Installation guide for indicators:
After installing the indicator, make sure that the indicator is merged with the price chart.
Secondly, ensure that the scale bar of the indicator merges with the scale bar of the price chart.
Sürüm Notları
Update default inputsSürüm Notları
Clean source code & InputsSürüm Notları
➕ Added the feature to view the highest and lowest price changes of the current bar compared to the previous bars.⚡⚡⚡Sürüm Notları
Clean source code 🚧🚧🚧Sürüm Notları
➕ Added the feature to view the changes in the current price bar.⚡⚡⚡Sürüm Notları
Clean source code 🚧🚧🚧Sürüm Notları
Update display current price 🚧🚧🚧Sürüm Notları
Fix bug 🚧🚧🚧Sürüm Notları
Fix bug 🚧🚧🚧Sürüm Notları
Fix bug 🚧🚧🚧Sürüm Notları
Fix bug 🚧🚧🚧Sürüm Notları
Fix bug 🚧🚧🚧Sürüm Notları
Fix bug 🚧🚧🚧Sürüm Notları
Fix bug 🚧🚧🚧Açık kaynak kodlu komut dosyası
Gerçek TradingView ruhuyla, bu komut dosyasının mimarı, yatırımcıların işlevselliğini inceleyip doğrulayabilmesi için onu açık kaynaklı hale getirdi. Yazarı tebrik ederiz! Ücretsiz olarak kullanabilseniz de, kodu yeniden yayınlamanın Topluluk Kurallarımıza tabi olduğunu unutmayın.
Feragatname
Bilgiler ve yayınlar, TradingView tarafından sağlanan veya onaylanan finansal, yatırım, alım satım veya diğer türden tavsiye veya öneriler anlamına gelmez ve teşkil etmez. Kullanım Koşulları bölümünde daha fazlasını okuyun.
Açık kaynak kodlu komut dosyası
Gerçek TradingView ruhuyla, bu komut dosyasının mimarı, yatırımcıların işlevselliğini inceleyip doğrulayabilmesi için onu açık kaynaklı hale getirdi. Yazarı tebrik ederiz! Ücretsiz olarak kullanabilseniz de, kodu yeniden yayınlamanın Topluluk Kurallarımıza tabi olduğunu unutmayın.
Feragatname
Bilgiler ve yayınlar, TradingView tarafından sağlanan veya onaylanan finansal, yatırım, alım satım veya diğer türden tavsiye veya öneriler anlamına gelmez ve teşkil etmez. Kullanım Koşulları bölümünde daha fazlasını okuyun.