OPEN-SOURCE SCRIPT
JADUGAAR_GORACHAND_V2
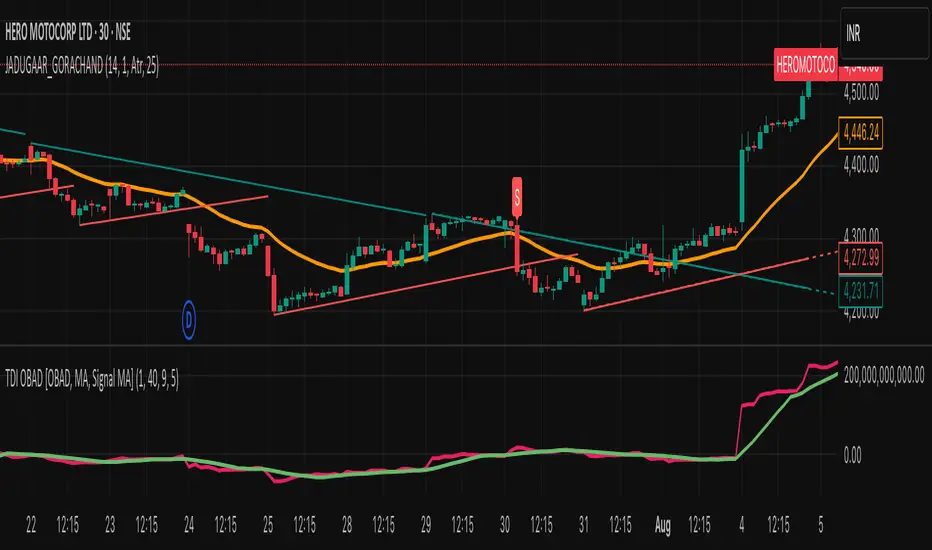
1. What is a Trendline?
A trendline is a straight line drawn on a chart that connects two or more price points. It helps visualize the direction and strength of a trend — uptrend, downtrend, or sideways.
🔼 2. Uptrend Line
An uptrend line connects higher lows. It acts as a support level, suggesting that buyers are in control. Price tends to bounce upward off this line during a bullish trend.
🔽 3. Downtrend Line
A downtrend line connects lower highs. It acts as a resistance level, indicating that sellers dominate. Price tends to fall after touching this line in a bearish trend.
🔄 4. Trendline Breaks
When price breaks a trendline, it may signal a potential trend reversal or trend weakening. Traders often use this for entry or exit signals.
📊 5. Trendline Validity
A trendline is more reliable when:
It touches 3 or more points
It's drawn over a longer time frame
There's strong volume on the breakout
Açık kaynak kodlu komut dosyası
Gerçek TradingView ruhuyla, bu komut dosyasının mimarı, yatırımcıların işlevselliğini inceleyip doğrulayabilmesi için onu açık kaynaklı hale getirdi. Yazarı tebrik ederiz! Ücretsiz olarak kullanabilseniz de, kodu yeniden yayınlamanın Topluluk Kurallarımıza tabi olduğunu unutmayın.
Feragatname
Bilgiler ve yayınlar, TradingView tarafından sağlanan veya onaylanan finansal, yatırım, alım satım veya diğer türden tavsiye veya öneriler anlamına gelmez ve teşkil etmez. Kullanım Koşulları bölümünde daha fazlasını okuyun.