OPEN-SOURCE SCRIPT
Ultimate Gold Correlation Matrix (Extended)
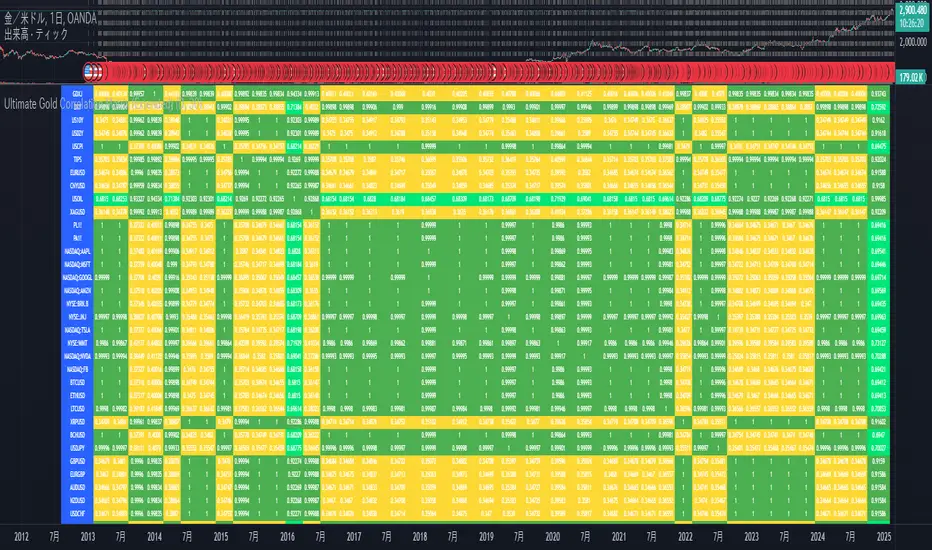
This is a correlation matrix to help you visually understand the relationship between stocks. This is the correlation of the amount of change.
The color changes depending on the value of the correlation value.
By making a node diagram of this relationship, what has been difficult to understand may become clearer.
Good luck.
1. meaning of correlation coefficient
Correlation Coefficient ranges from -1 to +1.
Correlation Coefficient Value Interpretation
+1.00 Perfect positive correlation (when one goes up, the other always goes up)
+0.75 ~ +0.99 Strong positive correlation (fairly well linked)
+0.50 ~ +0.74 Moderate positive correlation
+0.30 ~ +0.49 Weak positive correlation
-0.30 ~ +0.30 No correlation (no or weak relationship)
-0.50 ~ -0.74 Moderate negative correlation
-0.75 ~ -0.99 Strong negative correlation (when one goes up, the other goes down)
-1.00 Perfect negative correlation (opposite moves)
Translated with DeepL.com/Translator (free version)
Açık kaynak kodlu komut dosyası
Gerçek TradingView ruhuyla, bu komut dosyasının mimarı, yatırımcıların işlevselliğini inceleyip doğrulayabilmesi için onu açık kaynaklı hale getirdi. Yazarı tebrik ederiz! Ücretsiz olarak kullanabilseniz de, kodu yeniden yayınlamanın Topluluk Kurallarımıza tabi olduğunu unutmayın.
Feragatname
Bilgiler ve yayınlar, TradingView tarafından sağlanan veya onaylanan finansal, yatırım, alım satım veya diğer türden tavsiye veya öneriler anlamına gelmez ve teşkil etmez. Kullanım Koşulları bölümünde daha fazlasını okuyun.