RSI Overbought, Oversold and over/under midline
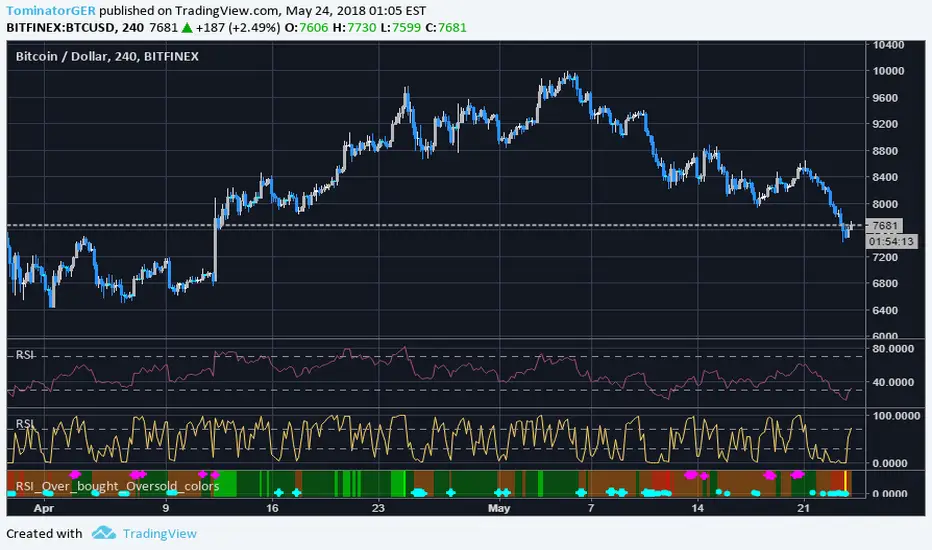
- Circles = RSI 2 period is in overbought /-sold -> Weaker buy / sell signal
- Cross = RSI 2 period is in overbought /-sold + price is above MA200 + below MA5 -> stronger buy / sell entry signal
- brown / dark green background = RSI 14 over or under midline -> Indicates bullish / bearisch momentum
- light red / green background = RSI 14 over 70 or under 30 -> Normal RSI overbought /-sold state
- red / bright green background = RSI 14 over 80 or under 20 -> Stronger RSI overbought /-sold state
- yellow background = RSI 14 over / under the 52 week high / low -> Very strong RSI overbought /-sold state
The indicator is designed to work on multiple chart layouts and smaller screens where you would not see the exact RSI states in the normal RSI indicator. You can also identify the RSI state very quick and it saves you space because you can identify the states even if the indicator window is very small.
Please give feedback in the comments what you think and what you would do better.
For access please leave a comment.
Yalnızca davetli komut dosyası
Bu komut dosyasına yalnızca yazar tarafından onaylanan kullanıcılar erişebilir. Kullanmak için izin istemeniz ve almanız gerekir. Bu genellikle ödeme yapıldıktan sonra verilir. Daha fazla ayrıntı için aşağıdaki yazarın talimatlarını izleyin veya doğrudan TominatorGER ile iletişime geçin.
TradingView, yazarına tamamen güvenmediğiniz ve nasıl çalıştığını anlamadığınız sürece bir komut dosyası için ödeme yapmanızı veya kullanmanızı TAVSİYE ETMEZ. Ayrıca topluluk komut dosyalarımızda ücretsiz, açık kaynaklı alternatifler bulabilirsiniz.
Yazarın talimatları
Feragatname
Yalnızca davetli komut dosyası
Bu komut dosyasına yalnızca yazar tarafından onaylanan kullanıcılar erişebilir. Kullanmak için izin istemeniz ve almanız gerekir. Bu genellikle ödeme yapıldıktan sonra verilir. Daha fazla ayrıntı için aşağıdaki yazarın talimatlarını izleyin veya doğrudan TominatorGER ile iletişime geçin.
TradingView, yazarına tamamen güvenmediğiniz ve nasıl çalıştığını anlamadığınız sürece bir komut dosyası için ödeme yapmanızı veya kullanmanızı TAVSİYE ETMEZ. Ayrıca topluluk komut dosyalarımızda ücretsiz, açık kaynaklı alternatifler bulabilirsiniz.