PROTECTED SOURCE SCRIPT
Güncellendi RVOL-Trading
Core Functionality
1. Dual RVOL Approach for Entry Confirmation
The script calculates two kinds of RVOLs for up to four intraday timeframes:
RVOL1 (based on daily average volume):
Formula: current intraday volume / 21-day SMA of daily volume
RVOL2 (based on same-timeframe average):
Formula: current intraday volume / average of past N intraday volumes (default 14)
The logic:
High RVOL1 → indicates unusual volume relative to daily historical averages.
High RVOL2 → indicates volume spike compared to typical activity at that timeframe.
2. Entry Signal – CheckGreen Condition
A bullish "Green" condition is triggered if:
Gap-up open (Opening_Price > 0)
Day’s low remains above previous close (strict lowCheck condition)
RVOL1 exceeds set thresholds (default 5% for 3m, 7% for 5m)
RVOL2 exceeds set thresholds (default 100%)
This is a strict entry filter, ensuring both price action and volume align.
💰 Position Sizing Logic
When enabled, the script calculates position size using three stop-loss methods:
Fixed SL % (e.g., 3%)
Day’s Low (LOD) below entry candle
Previous Day’s Low (PDL) below entry candle
🔢 Formula:
plaintext
Copy
Edit
Position Size = totalRisk / (entryPrice × stopLoss%)
Then it estimates position value as % of ₹1L capital (hardcoded).
Outputs include:
Number of shares
% distance to SL
Position size in lakhs (L)
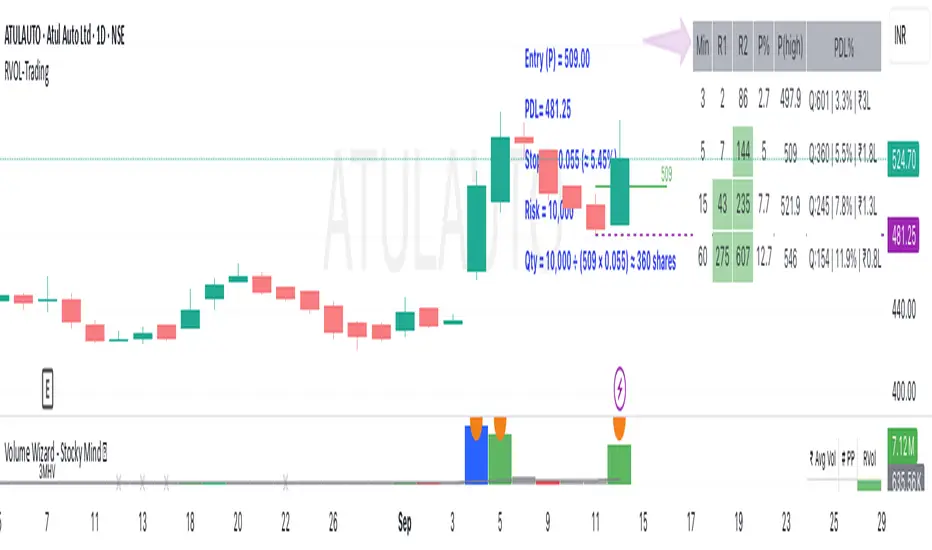
📋 RVOL Table Display
Displays in a table on the chart with the following columns:
Timeframe RVOL1 (%) RVOL2 (%) % Price Change Price SL % Position LOD-based Position PDL-based Position
Color coding helps identify which values meet thresholds.
📌 Customizable Inputs
✅ RVOL Inputs:
Days for SMA & historical volume (default: 21 & 14)
Timeframes: 3m, 5m, 15m, 60m (all configurable)
Thresholds for RVOL1, RVOL2, Gap %, and % price change
✅ Position Size Inputs:
Risk capital (default: ₹2500)
Enable/disable each SL type (SL %, LOD, PDL)
✅ Table Display:
Table size, color, location on chart
Enable/disable SL columns
🧩 Visual Elements
Draws horizontal levels for 5m/15m candle highs (if enabled)
Marks gap-up with a purple 'G' label
Color highlights on table cells for high RVOL or negative price moves
1. Dual RVOL Approach for Entry Confirmation
The script calculates two kinds of RVOLs for up to four intraday timeframes:
RVOL1 (based on daily average volume):
Formula: current intraday volume / 21-day SMA of daily volume
RVOL2 (based on same-timeframe average):
Formula: current intraday volume / average of past N intraday volumes (default 14)
The logic:
High RVOL1 → indicates unusual volume relative to daily historical averages.
High RVOL2 → indicates volume spike compared to typical activity at that timeframe.
2. Entry Signal – CheckGreen Condition
A bullish "Green" condition is triggered if:
Gap-up open (Opening_Price > 0)
Day’s low remains above previous close (strict lowCheck condition)
RVOL1 exceeds set thresholds (default 5% for 3m, 7% for 5m)
RVOL2 exceeds set thresholds (default 100%)
This is a strict entry filter, ensuring both price action and volume align.
💰 Position Sizing Logic
When enabled, the script calculates position size using three stop-loss methods:
Fixed SL % (e.g., 3%)
Day’s Low (LOD) below entry candle
Previous Day’s Low (PDL) below entry candle
🔢 Formula:
plaintext
Copy
Edit
Position Size = totalRisk / (entryPrice × stopLoss%)
Then it estimates position value as % of ₹1L capital (hardcoded).
Outputs include:
Number of shares
% distance to SL
Position size in lakhs (L)
📋 RVOL Table Display
Displays in a table on the chart with the following columns:
Timeframe RVOL1 (%) RVOL2 (%) % Price Change Price SL % Position LOD-based Position PDL-based Position
Color coding helps identify which values meet thresholds.
📌 Customizable Inputs
✅ RVOL Inputs:
Days for SMA & historical volume (default: 21 & 14)
Timeframes: 3m, 5m, 15m, 60m (all configurable)
Thresholds for RVOL1, RVOL2, Gap %, and % price change
✅ Position Size Inputs:
Risk capital (default: ₹2500)
Enable/disable each SL type (SL %, LOD, PDL)
✅ Table Display:
Table size, color, location on chart
Enable/disable SL columns
🧩 Visual Elements
Draws horizontal levels for 5m/15m candle highs (if enabled)
Marks gap-up with a purple 'G' label
Color highlights on table cells for high RVOL or negative price moves
Sürüm Notları
Enhance the formatting of the Table Korumalı komut dosyası
Bu komut dosyası kapalı kaynak olarak yayınlanmaktadır. Ancak, ücretsiz ve herhangi bir sınırlama olmaksızın kullanabilirsiniz – daha fazla bilgiyi buradan edinebilirsiniz.
Feragatname
Bilgiler ve yayınlar, TradingView tarafından sağlanan veya onaylanan finansal, yatırım, alım satım veya diğer türden tavsiye veya öneriler anlamına gelmez ve teşkil etmez. Kullanım Koşulları bölümünde daha fazlasını okuyun.
Korumalı komut dosyası
Bu komut dosyası kapalı kaynak olarak yayınlanmaktadır. Ancak, ücretsiz ve herhangi bir sınırlama olmaksızın kullanabilirsiniz – daha fazla bilgiyi buradan edinebilirsiniz.
Feragatname
Bilgiler ve yayınlar, TradingView tarafından sağlanan veya onaylanan finansal, yatırım, alım satım veya diğer türden tavsiye veya öneriler anlamına gelmez ve teşkil etmez. Kullanım Koşulları bölümünde daha fazlasını okuyun.