PROTECTED SOURCE SCRIPT
filbfilbs Better OBV

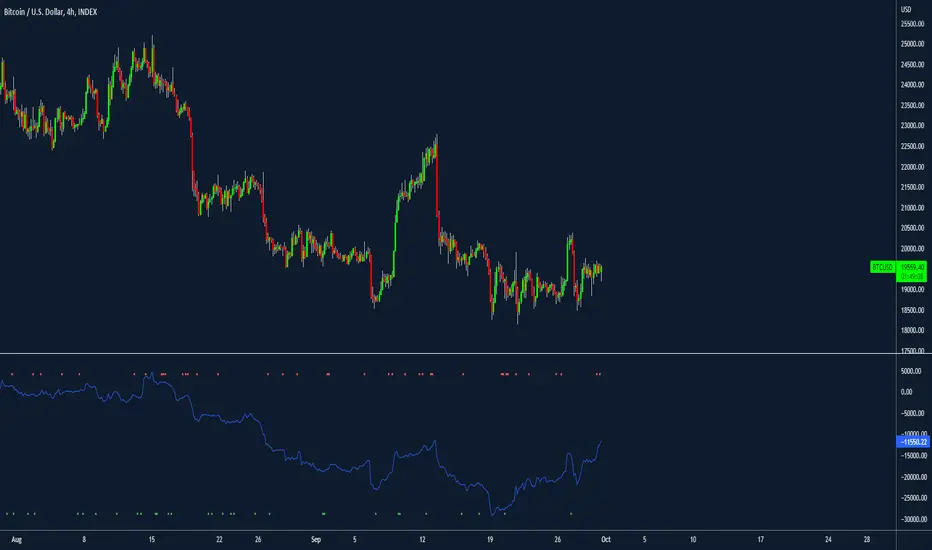
This indicator looks at the delta on the buying and selling volume of customizable lower timeframes to the timeframe selected and cumulates the delta between the buying and selling of those candles.
For example on a 4-hour chart, it will look at the 1 min timeframes and consider the delta by LTF candle, ranter than the summised view on the 4-hour.
In essence, it is trying to replicate CVD using time and price data without the order book, it becomes a "better, lower timeframe based, customizable OBV"
It also prints divergence as squares above or below the chart, where, for example, there would be buying on LTFs but the HTF candle closes red, this would be shown as bearish divergence.
Credit to Trading view and their up / down indicator, which this is a derivative of.
Any questions please ask!
Korumalı komut dosyası
Bu komut dosyası kapalı kaynak olarak yayınlanmaktadır. Ancak, ücretsiz ve herhangi bir sınırlama olmaksızın kullanabilirsiniz – daha fazla bilgiyi buradan edinebilirsiniz.
Feragatname
Bilgiler ve yayınlar, TradingView tarafından sağlanan veya onaylanan finansal, yatırım, alım satım veya diğer türden tavsiye veya öneriler anlamına gelmez ve teşkil etmez. Kullanım Koşulları bölümünde daha fazlasını okuyun.