Mayfair Heatmap Volume 1.0
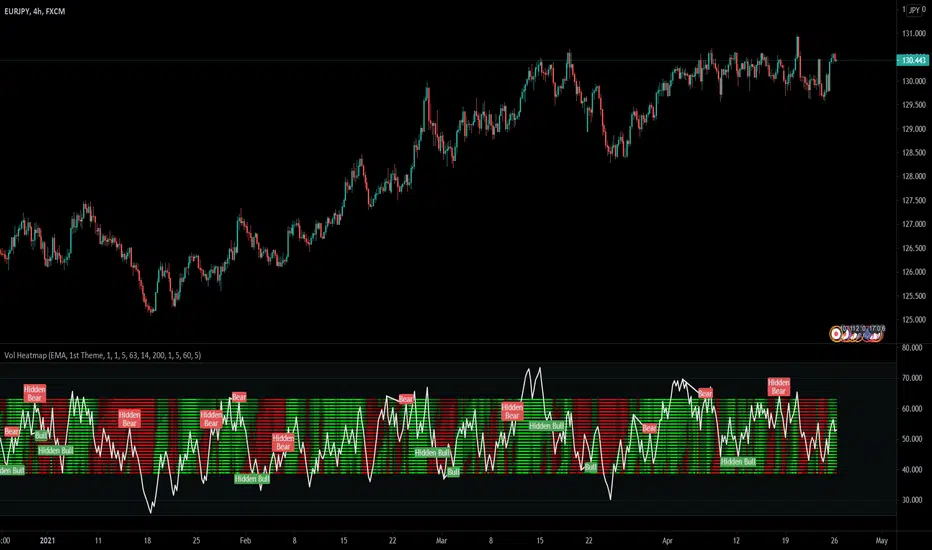
The heatmap area represents buying and selling pressure.
The white line works like a volume-driven RSI indicator, indicating overbought/oversold situations.
There is also a divergence indicator, represented by the Bear/Bull Hidden Bear/Hidden Bull markers, which show where the price action and the indicator's direction are moving in different directions.
Like all indicators, it is not perfect, and you should never rely on one indicator in any situation, but this one alerts you to opportunities, which you can then study on lower timeframes to find an entry.
Yalnızca davetli komut dosyası
Bu komut dosyasına yalnızca yazar tarafından onaylanan kullanıcılar erişebilir. Kullanmak için izin istemeniz ve almanız gerekir. Bu genellikle ödeme yapıldıktan sonra verilir. Daha fazla ayrıntı için aşağıdaki yazarın talimatlarını izleyin veya doğrudan Paul_Varcoe ile iletişime geçin.
TradingView, yazarına tamamen güvenmediğiniz ve nasıl çalıştığını anlamadığınız sürece bir komut dosyası için ödeme yapmanızı veya kullanmanızı TAVSİYE ETMEZ. Ayrıca topluluk komut dosyalarımızda ücretsiz, açık kaynaklı alternatifler bulabilirsiniz.
Yazarın talimatları
THE CITY TRADERS: thecitytraders.com/?aff=9
Discord: discord.gg/Ma7SnExcWA
Feragatname
Yalnızca davetli komut dosyası
Bu komut dosyasına yalnızca yazar tarafından onaylanan kullanıcılar erişebilir. Kullanmak için izin istemeniz ve almanız gerekir. Bu genellikle ödeme yapıldıktan sonra verilir. Daha fazla ayrıntı için aşağıdaki yazarın talimatlarını izleyin veya doğrudan Paul_Varcoe ile iletişime geçin.
TradingView, yazarına tamamen güvenmediğiniz ve nasıl çalıştığını anlamadığınız sürece bir komut dosyası için ödeme yapmanızı veya kullanmanızı TAVSİYE ETMEZ. Ayrıca topluluk komut dosyalarımızda ücretsiz, açık kaynaklı alternatifler bulabilirsiniz.
Yazarın talimatları
THE CITY TRADERS: thecitytraders.com/?aff=9
Discord: discord.gg/Ma7SnExcWA