PROTECTED SOURCE SCRIPT
TCT - Envelope Matrix
TCT - Envelope Matrix
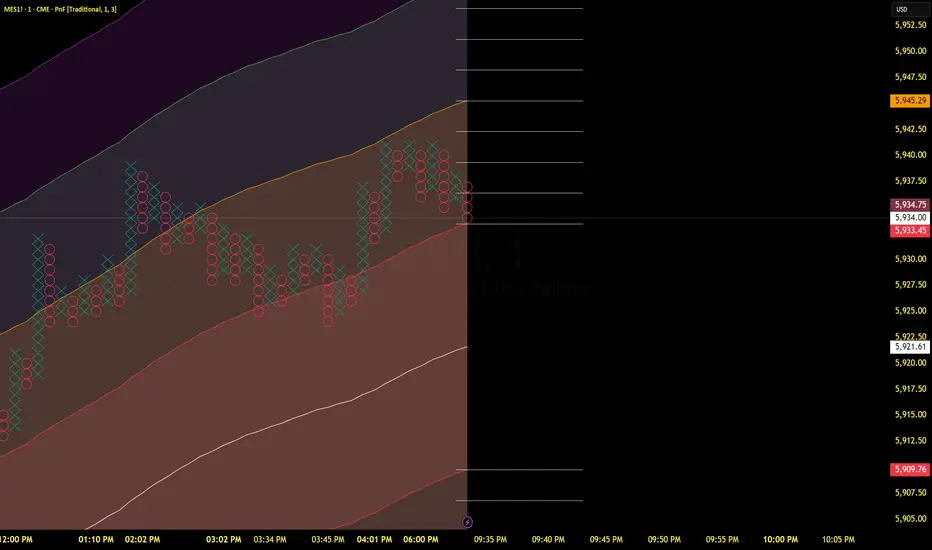
A powerful multi-envelope indicator that creates a comprehensive price channel system with 4 customizable envelopes and multiple intermediate levels for precise price action analysis.
Key Features:
• 4 customizable envelopes with adjustable percentages (0.2%, 0.4%, 0.6%, 0.8% by default)
• Optional EMA or SMA basis calculation
• Color-coded bands for easy visual identification
• Automatic horizontal lines showing current band values
• Midpoint lines between adjacent bands
• Additional 25%, 50%, and 75% levels between each band pair
The indicator provides:
- Clear visual representation of price channels
- Multiple support and resistance levels
- Dynamic price boundaries that adapt to market conditions
- Enhanced precision with intermediate levels between bands
Perfect for:
• Identifying potential support and resistance zones
• Spotting overbought/oversold conditions
• Finding potential reversal points
• Analyzing price volatility and channel width
• Making informed trading decisions based on price position relative to multiple bands
Customization Options:
• Adjustable length for the basis calculation
• Choice between EMA and SMA
• Customizable colors for each envelope
• Flexible percentage settings for each band
• Optional basis line color adjustment
This indicator is particularly useful for traders who want to analyze price action within multiple dynamic channels and identify potential trading opportunities based on price interactions with various support and resistance levels.
Korumalı komut dosyası
Bu komut dosyası kapalı kaynak olarak yayınlanmaktadır. Ancak, ücretsiz ve herhangi bir sınırlama olmaksızın kullanabilirsiniz – daha fazla bilgiyi buradan edinebilirsiniz.
Feragatname
Bilgiler ve yayınlar, TradingView tarafından sağlanan veya onaylanan finansal, yatırım, alım satım veya diğer türden tavsiye veya öneriler anlamına gelmez ve teşkil etmez. Kullanım Koşulları bölümünde daha fazlasını okuyun.