OPEN-SOURCE SCRIPT
D-LEVELS **FUTURECODE**
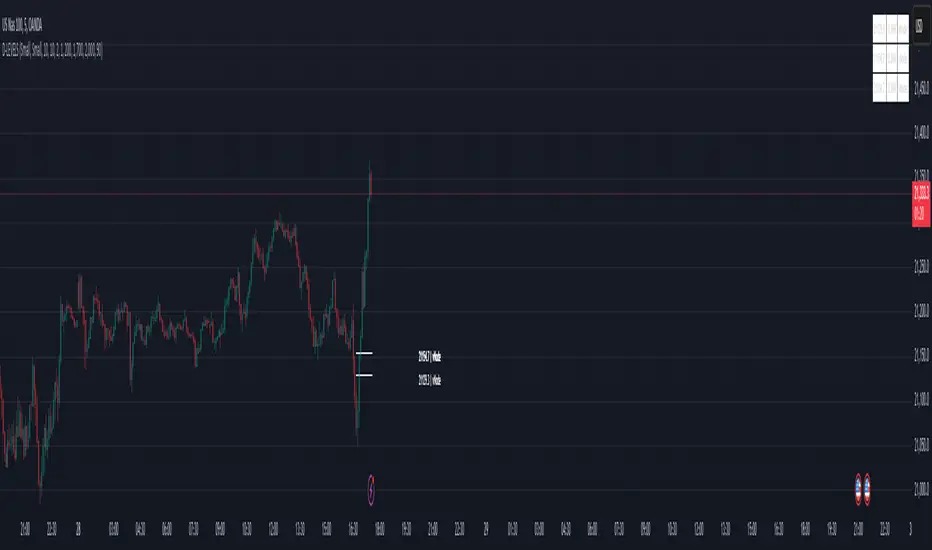
The D-LEVELS indicator helps traders identify key price levels based on high-volume nodes and their relative positions to the current price. It visually displays these dynamic levels on the chart, offering insights into potential support, resistance, or zones of interest for trading decisions.
Key Features for Traders:
Dynamic Volume Nodes: Highlights high-volume price levels across different lookback periods, which can act as support or resistance.
Custom Alerts: Warns traders when price is within a specified percentage range of these levels.
Visual Cues: Uses labels and lines with customizable colors and widths for better chart clarity.
Table Display: Summarizes volume node price levels and their relative percentages for quick reference.
Customization: Flexible input options for text size, colors, and display settings to adapt to individual trading styles.
Use Case:
Traders can incorporate this indicator into their strategy to identify high-probability zones for entries, exits, or trade management by observing the interaction of price with these volume-based levels.
Açık kaynak kodlu komut dosyası
Gerçek TradingView ruhuyla, bu komut dosyasının mimarı, yatırımcıların işlevselliğini inceleyip doğrulayabilmesi için onu açık kaynaklı hale getirdi. Yazarı tebrik ederiz! Ücretsiz olarak kullanabilseniz de, kodu yeniden yayınlamanın Topluluk Kurallarımıza tabi olduğunu unutmayın.
Feragatname
Bilgiler ve yayınlar, TradingView tarafından sağlanan veya onaylanan finansal, yatırım, alım satım veya diğer türden tavsiye veya öneriler anlamına gelmez ve teşkil etmez. Kullanım Koşulları bölümünde daha fazlasını okuyun.