OPEN-SOURCE SCRIPT
Volume Chart
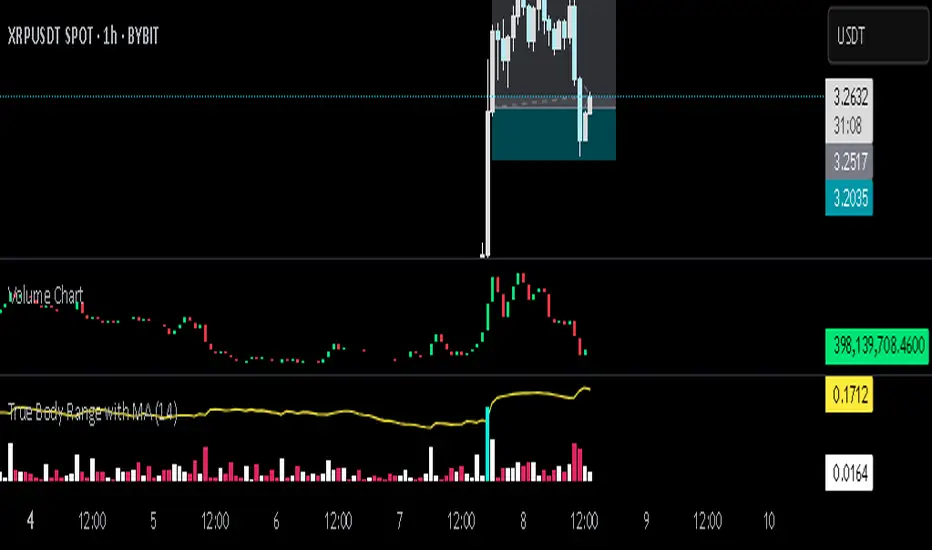
This Pine Script indicator, written in TradingView’s version 6, visualizes trading volume as a custom candlestick chart instead of a standard histogram. Rather than plotting volume bars, it constructs synthetic candles where each candle’s "open" is set to the previous candle’s "close" (stored in prevClose). The "close" of the synthetic candle moves upward by the volume value if the actual price candle was bullish (close > open) and downward by the volume value if it was bearish, with the "high" and "low" both fixed to the open to create a flat candle body line. This transforms volume into a price-like cumulative visual flow, color-coded green for bullish and red for bearish periods, allowing traders to intuitively track whether volume pressure is accumulating upward or downward over time, as though volume itself were moving like a market price series.
Açık kaynak kodlu komut dosyası
Gerçek TradingView ruhuyla, bu komut dosyasının mimarı, yatırımcıların işlevselliğini inceleyip doğrulayabilmesi için onu açık kaynaklı hale getirdi. Yazarı tebrik ederiz! Ücretsiz olarak kullanabilseniz de, kodu yeniden yayınlamanın Topluluk Kurallarımıza tabi olduğunu unutmayın.
Feragatname
Bilgiler ve yayınlar, TradingView tarafından sağlanan veya onaylanan finansal, yatırım, alım satım veya diğer türden tavsiye veya öneriler anlamına gelmez ve teşkil etmez. Kullanım Koşulları bölümünde daha fazlasını okuyun.