OPEN-SOURCE SCRIPT
Bollingers Bands Fibonacci ratios_copy of FOMO
Bollinger Bands Fibonacci Ratios (FiBB)
This TradingView script is a powerful tool that combines the classic Bollinger Bands with Fibonacci ratios to help traders identify potential support and resistance zones based on market volatility.
Key Features:
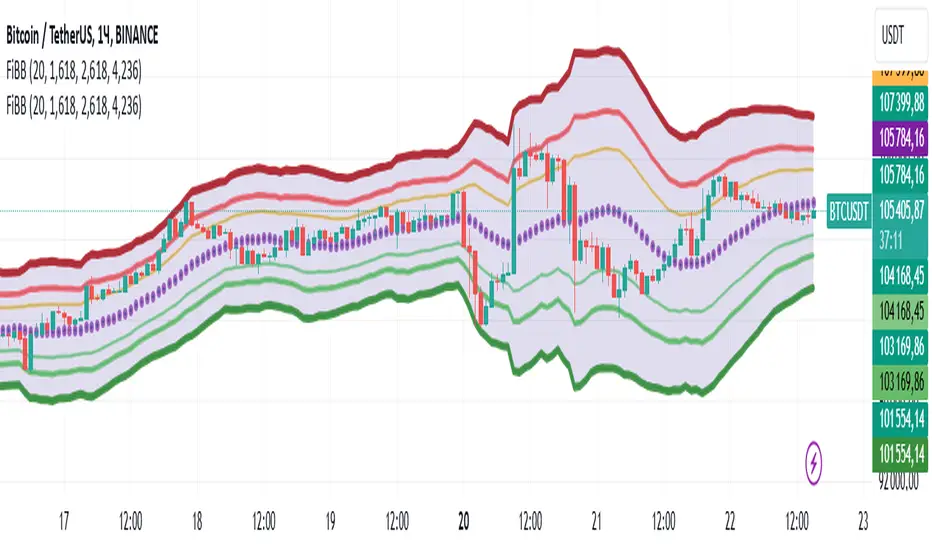
Dynamic Fibonacci Levels: The script calculates additional levels around a Simple Moving Average (SMA) using Fibonacci ratios (default: 1.618, 2.618, and 4.236). These levels adapt to market volatility using the Average True Range (ATR).
Customizable Parameters: Users can modify the length of the SMA and the Fibonacci ratios to fit their trading strategy and time frame.
Visual Representation: The indicator plots three upper and three lower bands, with color-coded transparency for easy interpretation.
Central SMA Line: The core SMA line provides a baseline for price movement and trend direction.
Shaded Range: The script visually fills the area between the outermost bands to highlight the overall range of price action.
How to Use:
Use the upper bands as potential resistance zones and the lower bands as potential support zones.
Look for price interactions with these levels to identify opportunities for breakout, trend continuation, or reversal trades.
Combine with other indicators or price action analysis to enhance decision-making.
This script is ideal for traders who want a unique blend of Fibonacci-based analysis and Bollinger Bands to better navigate market movements.
This TradingView script is a powerful tool that combines the classic Bollinger Bands with Fibonacci ratios to help traders identify potential support and resistance zones based on market volatility.
Key Features:
Dynamic Fibonacci Levels: The script calculates additional levels around a Simple Moving Average (SMA) using Fibonacci ratios (default: 1.618, 2.618, and 4.236). These levels adapt to market volatility using the Average True Range (ATR).
Customizable Parameters: Users can modify the length of the SMA and the Fibonacci ratios to fit their trading strategy and time frame.
Visual Representation: The indicator plots three upper and three lower bands, with color-coded transparency for easy interpretation.
Central SMA Line: The core SMA line provides a baseline for price movement and trend direction.
Shaded Range: The script visually fills the area between the outermost bands to highlight the overall range of price action.
How to Use:
Use the upper bands as potential resistance zones and the lower bands as potential support zones.
Look for price interactions with these levels to identify opportunities for breakout, trend continuation, or reversal trades.
Combine with other indicators or price action analysis to enhance decision-making.
This script is ideal for traders who want a unique blend of Fibonacci-based analysis and Bollinger Bands to better navigate market movements.
Açık kaynak kodlu komut dosyası
Gerçek TradingView ruhuyla, bu komut dosyasının mimarı, yatırımcıların işlevselliğini inceleyip doğrulayabilmesi için onu açık kaynaklı hale getirdi. Yazarı tebrik ederiz! Ücretsiz olarak kullanabilseniz de, kodu yeniden yayınlamanın Topluluk Kurallarımıza tabi olduğunu unutmayın.
Feragatname
Bilgiler ve yayınlar, TradingView tarafından sağlanan veya onaylanan finansal, yatırım, alım satım veya diğer türden tavsiye veya öneriler anlamına gelmez ve teşkil etmez. Kullanım Koşulları bölümünde daha fazlasını okuyun.