OPEN-SOURCE SCRIPT
Price Outpaces Moving Average
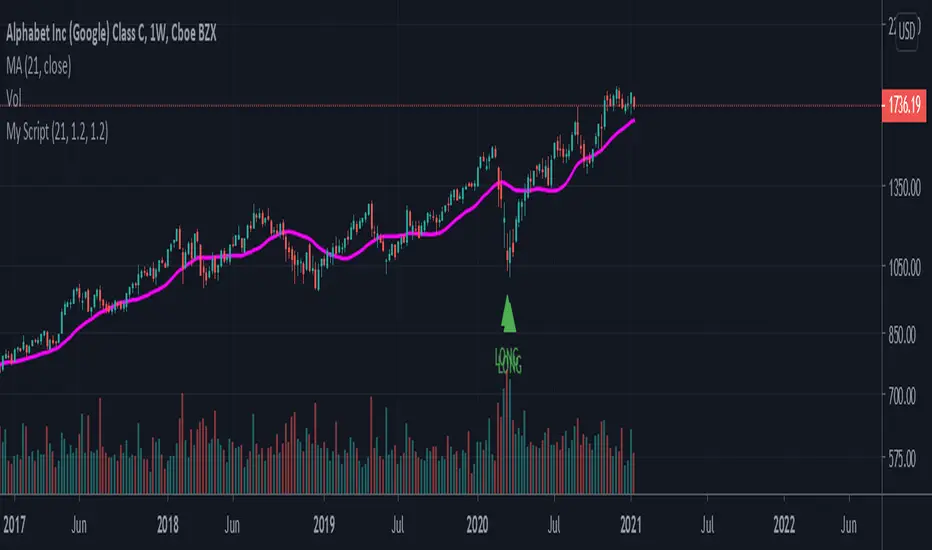
With inputs for the moving average, Bullish overshoot percentage, and bearish overshoot percentage, this indicator is attempting to show market tops based on the difference between the current price of an asset and how far away it is from its moving average.
If you have the bullish overshoot percentage set to 1.5:
let's say price is currently at 20,000 and the moving average is around 6500.
The script calculates 20,000/6500 = 3.07
Then, there is a boolean comparison asking if 3.07 > 1.5.
Since it is, the script will create a "SHORT" flag above that candlestick.
A similar process happens for the "LONG" flags.
Açık kaynak kodlu komut dosyası
Gerçek TradingView ruhuyla, bu komut dosyasının mimarı, yatırımcıların işlevselliğini inceleyip doğrulayabilmesi için onu açık kaynaklı hale getirdi. Yazarı tebrik ederiz! Ücretsiz olarak kullanabilseniz de, kodu yeniden yayınlamanın Topluluk Kurallarımıza tabi olduğunu unutmayın.
Feragatname
Bilgiler ve yayınlar, TradingView tarafından sağlanan veya onaylanan finansal, yatırım, alım satım veya diğer türden tavsiye veya öneriler anlamına gelmez ve teşkil etmez. Kullanım Koşulları bölümünde daha fazlasını okuyun.