PROTECTED SOURCE SCRIPT
Relative Strength Peers -> PROFABIGHI_CAPITAL
🌟 Overview
This indicator evaluates relative strength among a customizable group of assets by comparing their smoothed RSI values, identifying outperformers and underperformers through a scoring matrix. It generates visual tables to rank assets based on peer performance, aiding traders in spotting momentum leaders for potential allocation or rotation strategies.
⚙️ Settings
- Adjustable number of assets for analysis, balancing depth with performance
- RSI calculation period for momentum sensitivity
- Primary moving average type and length for initial RSI smoothing
- Optional secondary moving average type and length for advanced comparison
- Toggle for dual moving average scoring versus threshold-based evaluation
- Volatility lookback for adaptive smoothing in variable market conditions
- Table customization options like text size, header visibility, and input summaries
- Highlighting preferences for trends, top performers, and visual emphasis methods
- Enable/disable switches for RSI computations, table displays, and asset inputs
📊 Data Acquisition & Preparation
- Fetches real-time closing prices from selected asset tickers using security requests
- Cleans ticker symbols by removing exchange prefixes for consistent labeling
- Limits analysis to specified asset count to optimize processing speed
- Stores prices in dedicated variables per asset for efficient relative calculations
- Validates data integrity by detecting constant or invalid sources
- Builds an array of user-defined assets, supporting up to 40 cryptocurrency pairs
- Updates prices only on confirmed bars to ensure reliable historical alignment
📈 RSI Smoothing & Scoring Logic
- Computes base RSI on asset prices normalized against each peer for relative momentum
- Applies user-selected smoothing to RSI using various moving average methods
- Supports simple averages like SMA and EMA for basic trend filtering
- Includes advanced options such as HMA for reduced lag and VIDYA for volatility adaptation
- Handles double smoothing with optional second MA for crossover-based signals
- Assigns binary scores: outperforming (1) if smoothed RSI exceeds neutral threshold or faster MA leads slower one
- Aggregates scores across all peers into per-asset totals for overall strength ranking
- Ranks assets by descending sum, with ties preserved in top performer lists
📋 Matrix & Ranking Computation
- Constructs a comprehensive score matrix comparing each asset against every other
- Populates rows and columns with directional indicators for quick outperformance scans
- Sums row values to quantify an asset's dominance over the peer group
- Derives ranks through pairwise comparisons, prioritizing higher total scores
- Manages ties in rankings to ensure fair representation in leaderboards
- Combines matrix data into a flattened array for efficient table rendering
- Filters computations to active asset count, avoiding unnecessary overhead
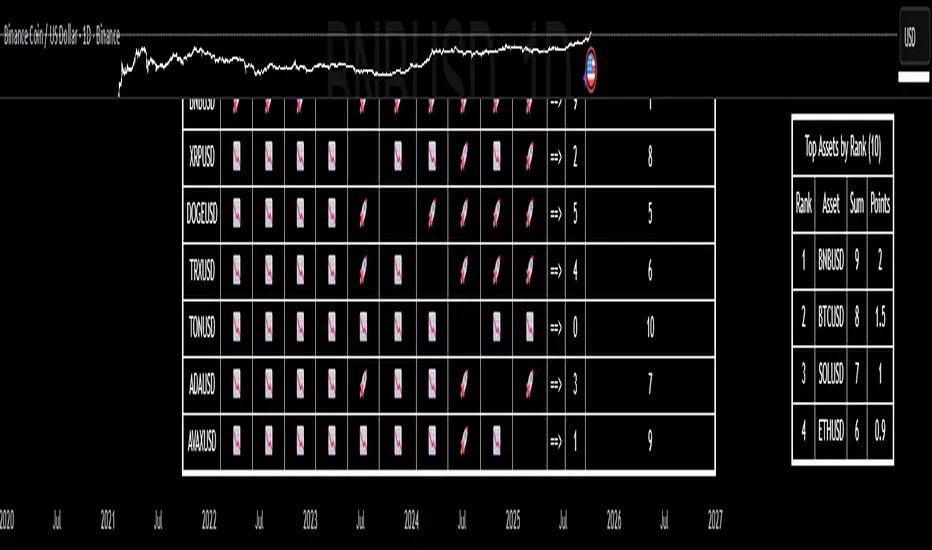
📉 Visualization
- Renders a main table as a heatmap-style matrix with rocket (🚀) for outperformance and down arrow (📉) for underperformance
- Displays asset labels along axes, with diagonal blanks to avoid self-comparisons
- Includes summary columns for total scores and final ranks, with optional gradient highlighting
- Positions a compact top assets table in the upper right, listing leaders with points allocation
- Customizes appearance via text sizing, background/text emphasis, and header toggles
- Shows input parameters summary row for quick reference without menu access
- Updates visuals only on the last bar for real-time relevance without repainting
🛠 Performance & Customization
- Conditional enabling of features like RSI analysis to reduce computational load
- Modular functions for price fetching, smoothing, and scoring to enhance maintainability
- Array-based storage for scalable handling of up to 40 assets without code bloat
- Inline options for MA configurations to streamline user interface
- Tooltip guidance on each input for contextual help during setup
- Fixed table positions (bottom center for main, top right for leaders) for consistent viewing
- Handles edge cases like zero volatility or missing data with fallback logic
✅ Key Takeaways
- Delivers peer-relative momentum insights through RSI-driven scoring and visual matrices
- Flexible smoothing and dual-MA modes adapt to diverse trading styles and sensitivities
- Prioritizes top performers with ranked tables, easing asset rotation decisions
- Optimizes for performance with toggles and limits, suitable for live trading dashboards
- Combines quantitative ranks with intuitive symbols for rapid market scanning
This indicator evaluates relative strength among a customizable group of assets by comparing their smoothed RSI values, identifying outperformers and underperformers through a scoring matrix. It generates visual tables to rank assets based on peer performance, aiding traders in spotting momentum leaders for potential allocation or rotation strategies.
⚙️ Settings
- Adjustable number of assets for analysis, balancing depth with performance
- RSI calculation period for momentum sensitivity
- Primary moving average type and length for initial RSI smoothing
- Optional secondary moving average type and length for advanced comparison
- Toggle for dual moving average scoring versus threshold-based evaluation
- Volatility lookback for adaptive smoothing in variable market conditions
- Table customization options like text size, header visibility, and input summaries
- Highlighting preferences for trends, top performers, and visual emphasis methods
- Enable/disable switches for RSI computations, table displays, and asset inputs
📊 Data Acquisition & Preparation
- Fetches real-time closing prices from selected asset tickers using security requests
- Cleans ticker symbols by removing exchange prefixes for consistent labeling
- Limits analysis to specified asset count to optimize processing speed
- Stores prices in dedicated variables per asset for efficient relative calculations
- Validates data integrity by detecting constant or invalid sources
- Builds an array of user-defined assets, supporting up to 40 cryptocurrency pairs
- Updates prices only on confirmed bars to ensure reliable historical alignment
📈 RSI Smoothing & Scoring Logic
- Computes base RSI on asset prices normalized against each peer for relative momentum
- Applies user-selected smoothing to RSI using various moving average methods
- Supports simple averages like SMA and EMA for basic trend filtering
- Includes advanced options such as HMA for reduced lag and VIDYA for volatility adaptation
- Handles double smoothing with optional second MA for crossover-based signals
- Assigns binary scores: outperforming (1) if smoothed RSI exceeds neutral threshold or faster MA leads slower one
- Aggregates scores across all peers into per-asset totals for overall strength ranking
- Ranks assets by descending sum, with ties preserved in top performer lists
📋 Matrix & Ranking Computation
- Constructs a comprehensive score matrix comparing each asset against every other
- Populates rows and columns with directional indicators for quick outperformance scans
- Sums row values to quantify an asset's dominance over the peer group
- Derives ranks through pairwise comparisons, prioritizing higher total scores
- Manages ties in rankings to ensure fair representation in leaderboards
- Combines matrix data into a flattened array for efficient table rendering
- Filters computations to active asset count, avoiding unnecessary overhead
📉 Visualization
- Renders a main table as a heatmap-style matrix with rocket (🚀) for outperformance and down arrow (📉) for underperformance
- Displays asset labels along axes, with diagonal blanks to avoid self-comparisons
- Includes summary columns for total scores and final ranks, with optional gradient highlighting
- Positions a compact top assets table in the upper right, listing leaders with points allocation
- Customizes appearance via text sizing, background/text emphasis, and header toggles
- Shows input parameters summary row for quick reference without menu access
- Updates visuals only on the last bar for real-time relevance without repainting
🛠 Performance & Customization
- Conditional enabling of features like RSI analysis to reduce computational load
- Modular functions for price fetching, smoothing, and scoring to enhance maintainability
- Array-based storage for scalable handling of up to 40 assets without code bloat
- Inline options for MA configurations to streamline user interface
- Tooltip guidance on each input for contextual help during setup
- Fixed table positions (bottom center for main, top right for leaders) for consistent viewing
- Handles edge cases like zero volatility or missing data with fallback logic
✅ Key Takeaways
- Delivers peer-relative momentum insights through RSI-driven scoring and visual matrices
- Flexible smoothing and dual-MA modes adapt to diverse trading styles and sensitivities
- Prioritizes top performers with ranked tables, easing asset rotation decisions
- Optimizes for performance with toggles and limits, suitable for live trading dashboards
- Combines quantitative ranks with intuitive symbols for rapid market scanning
Korumalı komut dosyası
Bu komut dosyası kapalı kaynak olarak yayınlanmaktadır. Ancak, özgürce ve herhangi bir sınırlama olmaksızın kullanabilirsiniz – daha fazla bilgi burada.
Feragatname
Bilgiler ve yayınlar, TradingView tarafından sağlanan veya onaylanan finansal, yatırım, işlem veya diğer türden tavsiye veya tavsiyeler anlamına gelmez ve teşkil etmez. Kullanım Şartları'nda daha fazlasını okuyun.