OPEN-SOURCE SCRIPT
QQE
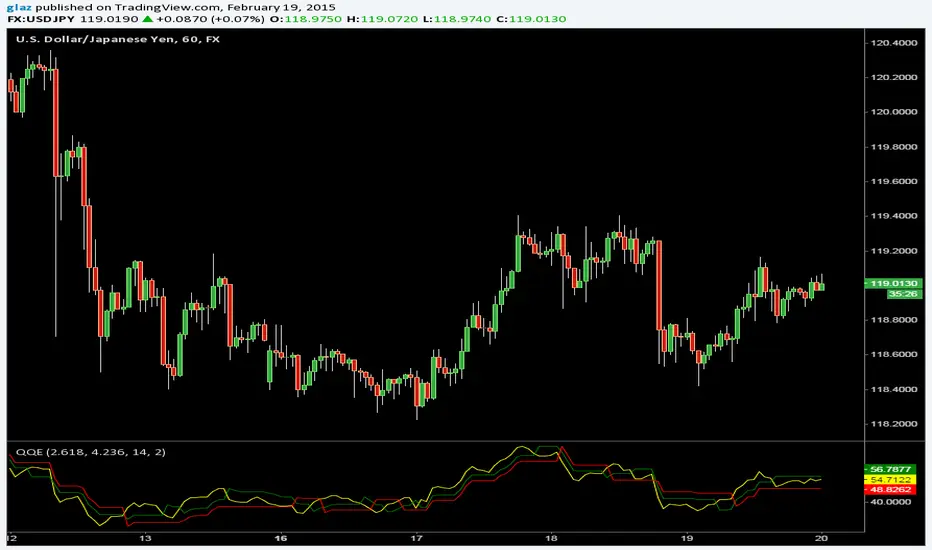
The Metastock version of Quantative Qualitative Estimation with two trailing stop lines and more options
Yellow line can be hidden if its too many signals and expirement with the Slow/Fast Trailing stop lines.
Yellow line can be hidden if its too many signals and expirement with the Slow/Fast Trailing stop lines.
Açık kaynak kodlu komut dosyası
Gerçek TradingView ruhuyla, bu komut dosyasının mimarı, yatırımcıların işlevselliğini inceleyip doğrulayabilmesi için onu açık kaynaklı hale getirdi. Yazarı tebrik ederiz! Ücretsiz olarak kullanabilseniz de, kodu yeniden yayınlamanın Topluluk Kurallarımıza tabi olduğunu unutmayın.
Feragatname
Bilgiler ve yayınlar, TradingView tarafından sağlanan veya onaylanan finansal, yatırım, alım satım veya diğer türden tavsiye veya öneriler anlamına gelmez ve teşkil etmez. Kullanım Koşulları bölümünde daha fazlasını okuyun.