OPEN-SOURCE SCRIPT
CM_ADX+DMI Mod
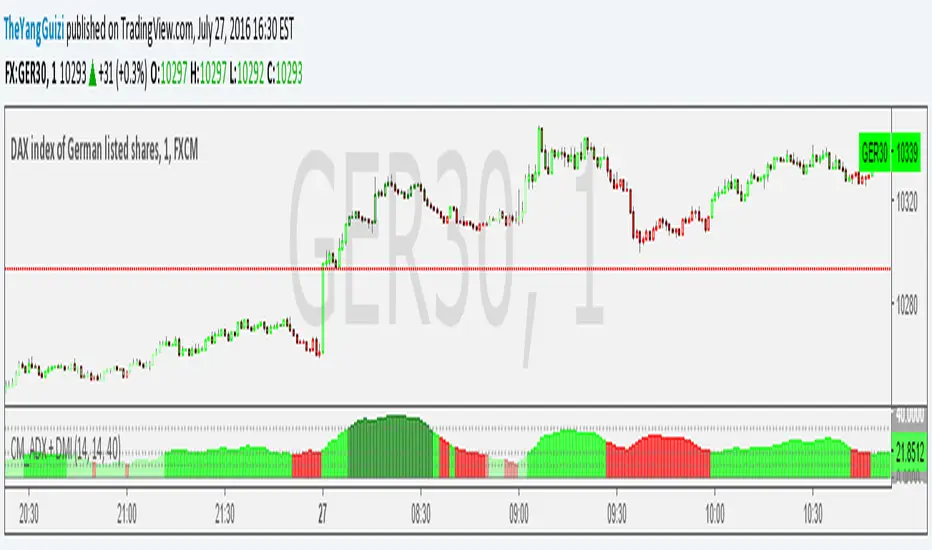
Mashed together Chris Moody's ADX thing with his DMI thing.
So you can see trend strength + direction
green-ish = uptrend-ish//red-ish = downtrend-ish
Colors can be adjusted though.
below 10 = gray, not much going on
10 - 20 = light green/light red, could be the beginning o something
20 - 40 = bright green / bright red, something is going on
above 40 = dark green, dark red, exhaustion (default is 40, can be adjusted to whatever)
Açık kaynak kodlu komut dosyası
Gerçek TradingView ruhuyla, bu komut dosyasının mimarı, yatırımcıların işlevselliğini inceleyip doğrulayabilmesi için onu açık kaynaklı hale getirdi. Yazarı tebrik ederiz! Ücretsiz olarak kullanabilseniz de, kodu yeniden yayınlamanın Topluluk Kurallarımıza tabi olduğunu unutmayın.
Feragatname
Bilgiler ve yayınlar, TradingView tarafından sağlanan veya onaylanan finansal, yatırım, alım satım veya diğer türden tavsiye veya öneriler anlamına gelmez ve teşkil etmez. Kullanım Koşulları bölümünde daha fazlasını okuyun.