OPEN-SOURCE SCRIPT
Güncellendi MACD+RSI+Flag v2 by RM
This source code is subject to the terms of the Mozilla Public License 2.0 at mozilla.org/MPL/2.0/
There are a number of very clever people I have taken bits of code and ideas, thanks to you all :) © raul3429
investopedia.com/
RSI: The relative strength index (RSI) is a momentum indicator measures recent price changes to evaluate overbought or oversold conditions.
MACD: Moving average convergence divergence (MACD) is a trend-following momentum indicator that shows the relationship between two moving averages of a security’s price. The MACD is = 12EMA - 26EMA, The histogram represent this difference.
Notes:
This code has Flags for first candle change during oversold/overbought shown as triangles, also and MACD 12 and MACD 26 crossings as diamonds. These are sometimes indicators of trend change.
RSI has been scaled down by "scaleRSI" parameter to enable plotting alongside MACD
Depending on the security being evaluated the RSI scale may need to be adjusted as the MACD ranges vary between symbols.
Disclaimer:
This is not a Financial advisory tool. For education purposes only. Use at your own risk.
Sürüm Notları
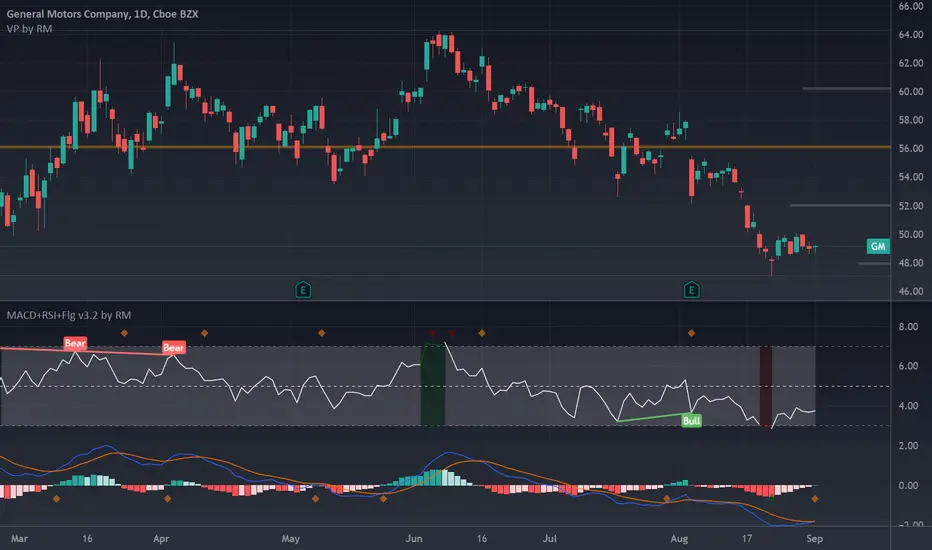
This update (v3) has improved visibility of overbought/oversold conditions in the RSI chart component. This code has Flags for first candle change during oversold/overbought shown as triangles, also and MACD 12 and MACD 26 crossings as diamonds.
RSI has been scaled down by "scaleRSI" parameter to enable plotting alongside MACD. User may need to adjust Scale as required to shown RSI & MACD.
RSI: The relative strength index (RSI) is a momentum indicator measures recent price changes to evaluate overbought or oversold conditions.
MACD: Moving average convergence divergence (MACD) is a trend-following momentum indicator that shows the relationship between two moving averages of a security’s price. The MACD is = 12EMA - 26EMA, The histogram represent this difference.
Disclaimer: This is not a Financial advisory tool. For education purposes only. Use at your own risk.
Sürüm Notları
V3.2 Added Divergence indicator plus other minor changes (color definition, inclusion of color to indicator line and band, fixed scaling and improved explanations)Açık kaynak kodlu komut dosyası
Gerçek TradingView ruhuyla, bu komut dosyasının mimarı, yatırımcıların işlevselliğini inceleyip doğrulayabilmesi için onu açık kaynaklı hale getirdi. Yazarı tebrik ederiz! Ücretsiz olarak kullanabilseniz de, kodu yeniden yayınlamanın Topluluk Kurallarımıza tabi olduğunu unutmayın.
Feragatname
Bilgiler ve yayınlar, TradingView tarafından sağlanan veya onaylanan finansal, yatırım, alım satım veya diğer türden tavsiye veya öneriler anlamına gelmez ve teşkil etmez. Kullanım Koşulları bölümünde daha fazlasını okuyun.
Açık kaynak kodlu komut dosyası
Gerçek TradingView ruhuyla, bu komut dosyasının mimarı, yatırımcıların işlevselliğini inceleyip doğrulayabilmesi için onu açık kaynaklı hale getirdi. Yazarı tebrik ederiz! Ücretsiz olarak kullanabilseniz de, kodu yeniden yayınlamanın Topluluk Kurallarımıza tabi olduğunu unutmayın.
Feragatname
Bilgiler ve yayınlar, TradingView tarafından sağlanan veya onaylanan finansal, yatırım, alım satım veya diğer türden tavsiye veya öneriler anlamına gelmez ve teşkil etmez. Kullanım Koşulları bölümünde daha fazlasını okuyun.