OPEN-SOURCE SCRIPT
China's stock market volume ratio
1. Introduction to Volume Ratio:
In China's stock market, the volume ratio is an indicator used to measure relative trading volume. It compares the average volume per minute after the market opens to the average volume per minute over the past five trading days.
2. Application of Volume Ratio:
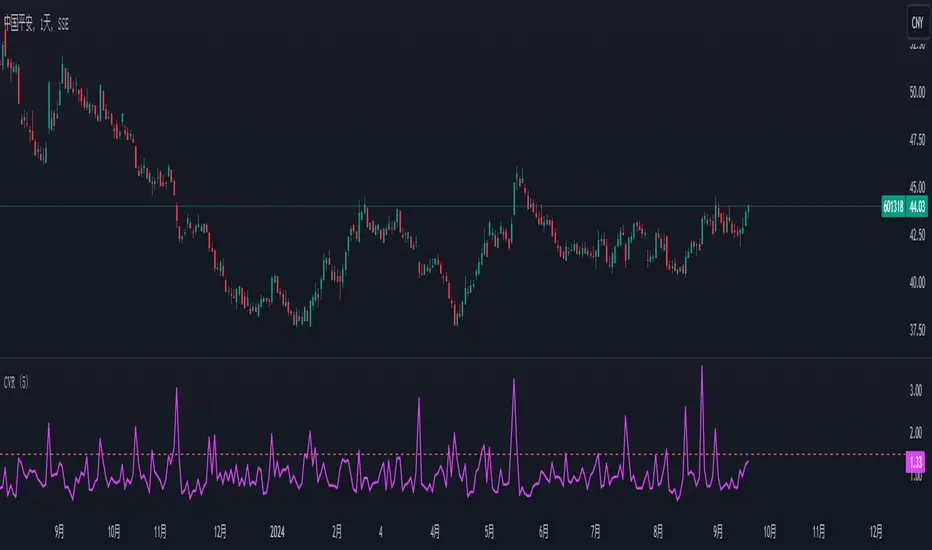
When there is a sudden surge in volume, the volume ratio chart will show a sharp upward break, indicating an increase in trading volume (initial market movements can be disregarded). Conversely, when volume contracts, the volume ratio will move downward.
If the volume ratio is greater than 1, it indicates that the average trading volume per minute for the current day is higher than the average over the past five days, signifying increased trading activity.
If the volume ratio is less than 1, it means that today's trading volume is lower than the average of the past five days, indicating decreased trading activity.
3. Volume Ratio Calculation:
The formula for calculating the volume ratio is:
Volume Ratio=Current Total Volume/(Average Volume per Minute over the Last 5 Days * Accumulated Market Open Time (in minutes))
In China's stock market, the volume ratio is an indicator used to measure relative trading volume. It compares the average volume per minute after the market opens to the average volume per minute over the past five trading days.
2. Application of Volume Ratio:
When there is a sudden surge in volume, the volume ratio chart will show a sharp upward break, indicating an increase in trading volume (initial market movements can be disregarded). Conversely, when volume contracts, the volume ratio will move downward.
If the volume ratio is greater than 1, it indicates that the average trading volume per minute for the current day is higher than the average over the past five days, signifying increased trading activity.
If the volume ratio is less than 1, it means that today's trading volume is lower than the average of the past five days, indicating decreased trading activity.
3. Volume Ratio Calculation:
The formula for calculating the volume ratio is:
Volume Ratio=Current Total Volume/(Average Volume per Minute over the Last 5 Days * Accumulated Market Open Time (in minutes))
Açık kaynak kodlu komut dosyası
Gerçek TradingView ruhuyla, bu komut dosyasının mimarı, yatırımcıların işlevselliğini inceleyip doğrulayabilmesi için onu açık kaynaklı hale getirdi. Yazarı tebrik ederiz! Ücretsiz olarak kullanabilseniz de, kodu yeniden yayınlamanın Topluluk Kurallarımıza tabi olduğunu unutmayın.
Feragatname
Bilgiler ve yayınlar, TradingView tarafından sağlanan veya onaylanan finansal, yatırım, alım satım veya diğer türden tavsiye veya öneriler anlamına gelmez ve teşkil etmez. Kullanım Koşulları bölümünde daha fazlasını okuyun.