OPEN-SOURCE SCRIPT
BB - MFI/RSI [Modified from LazyBear]
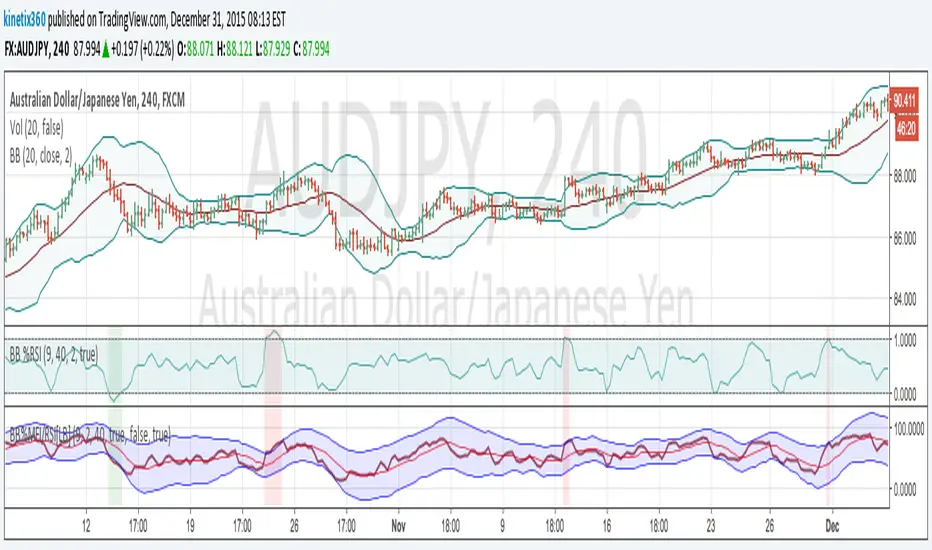
Here is the modification from BB-MFI/RSI from LazyBear. I add the period for the BB as told by John Bollinger in his book.
Base on his book, he suggest to try :
9p RSI with 40p BB and Stdv 2.0
14p RSI with 50p BB and Stdv 2.1
10p MFI with 40p BB and Stdv 2.0
The idea is to compare the short period in indicator with Long period of BB.
Base on his book, he suggest to try :
9p RSI with 40p BB and Stdv 2.0
14p RSI with 50p BB and Stdv 2.1
10p MFI with 40p BB and Stdv 2.0
The idea is to compare the short period in indicator with Long period of BB.
Açık kaynak kodlu komut dosyası
Gerçek TradingView ruhuna uygun olarak, bu komut dosyasının oluşturucusu bunu açık kaynaklı hale getirmiştir, böylece yatırımcılar betiğin işlevselliğini inceleyip doğrulayabilir. Yazara saygı! Ücretsiz olarak kullanabilirsiniz, ancak kodu yeniden yayınlamanın Site Kurallarımıza tabi olduğunu unutmayın.
Feragatname
Bilgiler ve yayınlar, TradingView tarafından sağlanan veya onaylanan finansal, yatırım, işlem veya diğer türden tavsiye veya tavsiyeler anlamına gelmez ve teşkil etmez. Kullanım Şartları'nda daha fazlasını okuyun.