OPEN-SOURCE SCRIPT
Strategy RSI Backtest
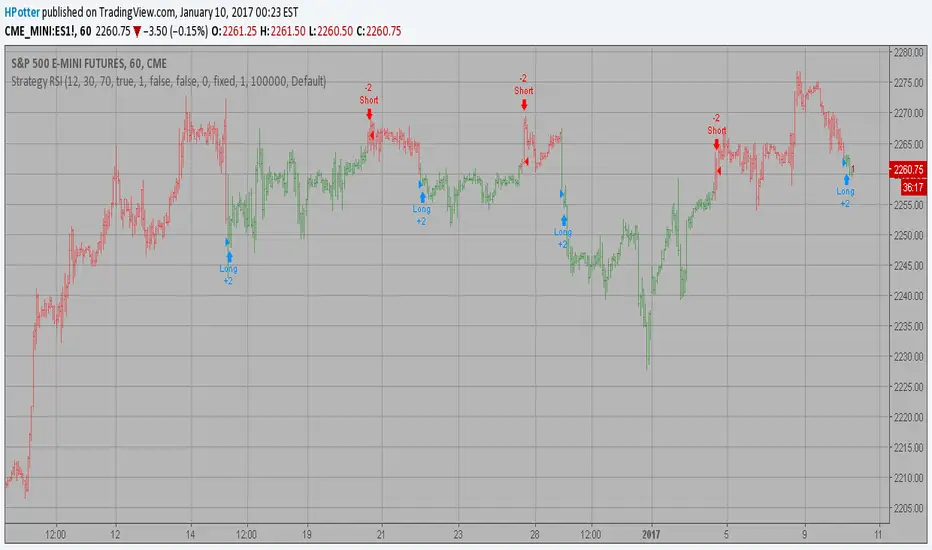
The RSI is a very popular indicator that follows price activity.
It calculates an average of the positive net changes, and an average
of the negative net changes in the most recent bars, and it determines
the ratio between these averages. The result is expressed as a number
between 0 and 100. Commonly it is said that if the RSI has a low value,
for example 30 or under, the symbol is oversold. And if the RSI has a
high value, 70 for example, the symbol is overbought.
You can change long to short in the Input Settings
Please, use it only for learning or paper trading. Do not for real trading.
Açık kaynak kodlu komut dosyası
Gerçek TradingView ruhuyla, bu komut dosyasının mimarı, yatırımcıların işlevselliğini inceleyip doğrulayabilmesi için onu açık kaynaklı hale getirdi. Yazarı tebrik ederiz! Ücretsiz olarak kullanabilseniz de, kodu yeniden yayınlamanın Topluluk Kurallarımıza tabi olduğunu unutmayın.
Feragatname
Bilgiler ve yayınlar, TradingView tarafından sağlanan veya onaylanan finansal, yatırım, alım satım veya diğer türden tavsiye veya öneriler anlamına gelmez ve teşkil etmez. Kullanım Koşulları bölümünde daha fazlasını okuyun.