PROTECTED SOURCE SCRIPT
AR–Volumized Blocks & S&D
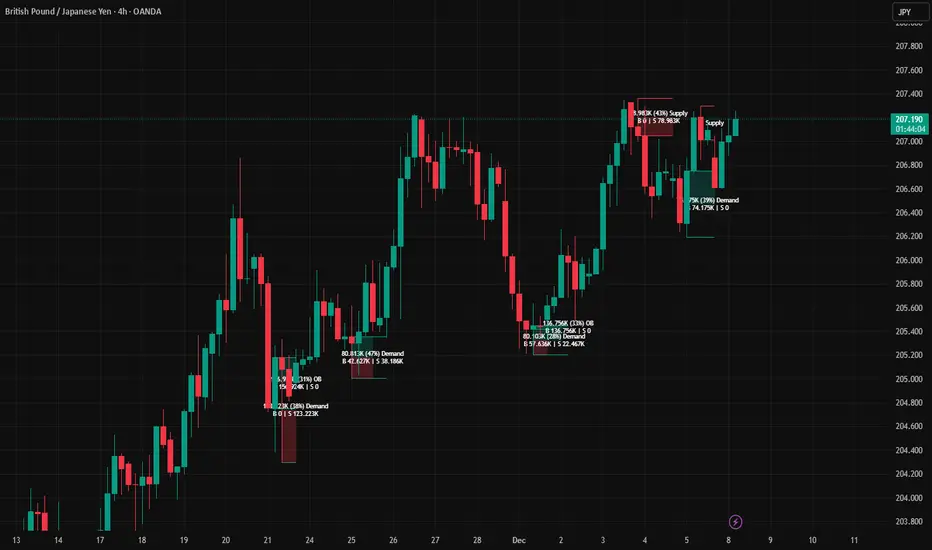
AR–Volumized Blocks & S&D is a clean, price-action order-block tool that automatically detects Bullish & Bearish Order Blocks (OB), tracks their evolving state into Mitigation Blocks (MB) and Breaker Blocks (BB), and adds a volumetric overlay showing an estimated split between buyers vs sellers inside each zone. It also includes a lightweight Supply & Demand (S&D) module with the same buy/sell visualization.
This indicator is designed to keep the chart readable: zones are drawn with thin boundaries, optional breaker fill, short reference lines, centered labels, and shortened volumetric bars (instead of huge full-width blocks).
________________________________________
What it draws
1) Order Blocks with State Tracking
Each detected Order Block is shown with:
• Top/Bottom boundaries (thin lines)
• A zone container (mostly invisible for OB/MB, semi-filled for BB)
• A label that updates live with:
o Total zone volume
o Volumetric balance %
o Current state: OB / MB / BB
o Optional extra line: Buy vs Sell estimate
States
• OB (Order Block): Newly detected zone, still valid.
• MB (Mitigation Block): Zone has been touched by price (mitigated) but not broken.
• BB (Breaker Block): Zone has been invalidated (broken through) and becomes a breaker.
Optional BB cleanup
• “Hide invalidated BB” can auto-remove breaker blocks that become invalid again (to keep the chart clean and only show active breakers).
________________________________________
2) Supply & Demand Zones
Supply & Demand zones are detected using pivot logic:
• Supply: pivot highs → zone from pivot high down to pivot candle body area
• Demand: pivot lows → zone from pivot low up to pivot candle body area
They are drawn as:
• A zone holder + thin lines
• A label (“Supply” / “Demand”), with optional volumetric text
• Optional buy/sell volumetric bars, same style as OB/BB/MB
S&D zones are removed completely once broken (clean and decisive behavior).
________________________________________
Volumetric Buy/Sell (the mini bars + text)
This script adds an extra layer called Volumetric (Buy/Sell):
-Volumetric Bars (short + clean)
Inside each zone, it can draw two small stacked bars:
• Top half: Buy volume (green)
• Bottom half: Sell volume (red)
You can choose:
• Display side (Left or Right of the zone)
• Bar length in bars (shortened by design)
• Transparency
-Volumetric Text (buyers vs sellers)
The label can optionally show:
• B 123K | S 98K
So you instantly see who dominated in that block.
Important Note (Very Honest)
These buy/sell numbers are NOT real bid/ask delta.
They are an estimate based on candle direction:
• If a candle closes green (close ≥ open) → its volume is counted as “buy”
• If it closes red (close < open) → its volume is counted as “sell”
This is still extremely useful for visual confirmation, but it is not a broker-level footprint.
________________________________________
Detection Logic Summary (simple + effective)
Order Block detection (swing-based)
• Uses a swing finder to identify relevant turning points.
• Confirms OB creation on a breakout beyond the swing level.
• Builds the OB range by walking backward to capture the strongest base candle area.
• Filters out oversized zones using ATR × Max OB height filter.
Zone lifetime handling
• Zones extend forward automatically.
• OB becomes MB on first meaningful touch.
• OB becomes BB if violated in the opposite direction.
• BB can optionally be hidden if it becomes invalid (depending on your settings).
________________________________________
Inputs & Customization
Detection
• Swing length (OB): controls sensitivity. Lower = more zones, higher = fewer stronger zones.
• Use candle body for extremes: reduces wick noise by using candle bodies for boundaries.
• ATR filter: avoids huge messy blocks (keeps zones tradable).
• Max zones to keep: keeps chart lightweight.
Visual
• Bull/Bear colors
• Label size
• Forward extension
• Short line length
• Label offset
Supply & Demand
• Enable/disable S&D
• Pivot swing length
• Forward extension, line length
• Label offset X and Y (ticks)
• Max S&D zones
Volumetric Buy/Sell
• Turn bars on/off
• Turn text on/off
• Bars side (left/right)
• Bar length (short, by bars)
• Bar transparency
________________________________________
How to use (practical workflow)
For Entries
• Use Bullish OB / Demand as a potential buy zone after a displacement up.
• Use Bearish OB / Supply as a potential sell zone after a displacement down.
• Look for confluence:
o market structure shift / BOS + displacement candle + return to OB/MB
For Bias Filtering
• The buy/sell split helps you quickly sanity-check:
o A “bullish OB” that shows heavy sell dominance might be weaker (and vice versa)
o Strong imbalance zones often show a clear dominance split
For Risk Management
• BB zones are great “line in the sand” areas.
• Use zone boundaries for invalidation, with your own model rules.
________________________________________
Performance Notes
This script is built with object limits in mind and includes:
• max_boxes_count, max_lines_count, max_labels_count
• Cleanup logic when max zones are exceeded
• Optional hiding of invalid breakers to reduce clutter
________________________________________
Disclaimer
This tool provides technical visualization and estimated volumetric info based on candle direction. It does not represent true order flow, bid/ask delta, or broker tape. Always risk-manage properly and confirm with your trading plan.
Korumalı komut dosyası
Bu komut dosyası kapalı kaynak olarak yayınlanmaktadır. Ancak, ücretsiz ve herhangi bir sınırlama olmaksızın kullanabilirsiniz – daha fazla bilgiyi buradan edinebilirsiniz.
Feragatname
Bilgiler ve yayınlar, TradingView tarafından sağlanan veya onaylanan finansal, yatırım, alım satım veya diğer türden tavsiye veya öneriler anlamına gelmez ve teşkil etmez. Kullanım Koşulları bölümünde daha fazlasını okuyun.