PROTECTED SOURCE SCRIPT
Güncellendi Cross-Exchange Any Volume[nakano]
# Cross-Exchange Any Volume
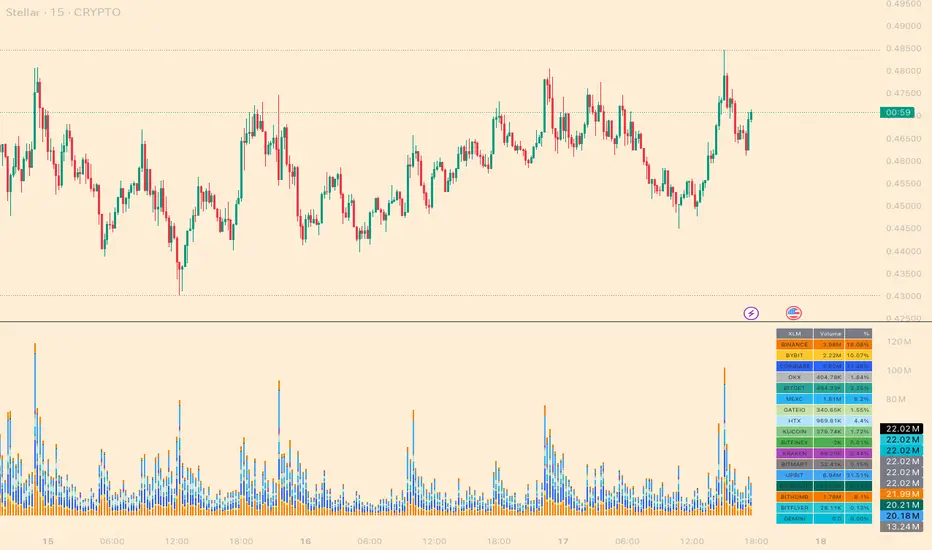
This indicator aggregates the real-time trading volume of a specific crypto asset across multiple exchanges and displays it as a single, stacked column chart. It allows you to grasp the total volume and its composition across the market at a glance.
このインジケーターは、複数の取引所における特定の暗号資産の出来高をリアルタイムで合算し、一つの積み上げ棒グラフに表示します。市場全体の総出来高とその内訳を、一目で把握することができます。
## Features / 主な機能
* **Aggregate up to 20 Exchanges:** Simultaneously calculates and displays the volume from up to 20 user-defined exchanges.
* 最大20の取引所の出来高を同時に集計・表示します。
* **Customizable Exchanges:** Freely customize the exchange prefix for each slot in the settings (e.g., `BINANCE`, `COINBASE`, `BYBIT`).
* 設定画面から各取引所の取引所プリフィックスを自由に変更可能です(例:`BINANCE`、`COINBASE`、`BYBIT`)。
* **Flexible Quote Currencies:** Specify the quote currencies you want to aggregate for each exchange in a comma-separated list (e.g., `USDT,USDC`).
* 取引所ごとに集計したいクォート通貨をカンマ区切りで指定可能です(例:`USDT,USDC`)。
* **Individual Configuration:** Individually configure the color and visibility (On/Off) for each exchange slot.
* 各取引所の色や表示/非表示を個別に設定できます。
* **On-Chart Details:** Display a detailed volume breakdown on the chart as either a Table or a Label. Text size is also adjustable.
* チャート上に出来高の内訳をテーブル形式またはラベル形式で表示できます。文字サイズの調整も可能です。
* **Debug Report:** Includes a date-range-specific cumulative volume report for debugging and analysis purposes.
* デバッグや分析目的で、指定した期間の累計出来高レポートを表示する機能を搭載しています。
## How to Use / 設定方法
1. **Set Base Asset:** In the settings, enter the crypto asset symbol you want to analyze into the `Base Asset` field (e.g., `BTC`, `ETH`, `SOL`).
* 設定画面の`Base Asset`に、分析したい暗号資産のシンボル(例:`BTC`, `ETH`, `SOL`)を入力します。
2. **Configure Exchanges:** For each row (1-20), enable the checkbox for the exchange you want to use. Then, enter the correct exchange prefix (e.g., `BINANCE`) and the desired quote currencies (e.g., `USDT,USDC`). You can also customize the display color.
* 各行(1〜20)で、使用したい取引所のチェックボックスをONにします。次に、正しい取引所プリフィックス(例:`BINANCE`)と、集計したいクォート通貨(例:`USDT,USDC`)を入力します。表示色も自由にカスタマイズできます。
3. **Disable Unused Slots:** For any slots you are not using, simply leave the checkbox disabled. The script will ignore them.
* 不要なスロットは、チェックボックスをOFFのままにしてください。スクリプトはそれらを無視します。
## Notes / 注意事項
* **`request.security` Call Limit:** Pine Script has a limit on `request.security` calls (around 40 per script). If the total number of quote currencies across all enabled exchanges exceeds this limit, the script will stop with an error. For example, `USDT,USDC` counts as two pairs. Please be mindful of the total number of pairs in use.
* **`request.security`の呼び出し回数上限**: Pine Scriptには、スクリプトあたりの`request.security`呼び出し回数に上限(約40回)があります。有効にした全取引所のクォート通貨の合計数がこの上限を超えると、スクリプトはエラーで停止します。例えば、`USDT,USDC`は2ペアとしてカウントされます。有効にするペアの合計数にご注意ください。
* **Debug Report Timeout:** The Debug Report feature aggregates data over every single bar within the specified date range. Using this feature with a long date range on short timeframes (like the 1-minute chart) may cause the script to exceed TradingView's calculation limits and time out. It is recommended to use a shorter time range when enabling this feature on low timeframes.
* **デバッグレポートのタイムアウト**: デバッグレポート機能は、指定された期間のすべてのバーのデータを集計するため、特に1分足などの短い時間足で長期間を指定すると、TradingViewの計算リソースの限界を超え、チャートの読み込みがタイムアウトする可能性があります。この機能を使用する際は、短い期間に絞ってお試しいただくことをお勧めします。
Sürüm Notları
# Release Notes**Cross-Exchange Any Volume Indicator – Update**
- **Base Asset Selection Enhanced:**
Added a dropdown to choose between “Current Chart” (auto-detects base asset from the chart symbol) and “Custom” (manual input).
- **Table Header Improvements:**
The main volume table’s header now dynamically displays the selected base asset (e.g., BTC, ETH).
- **Text Size Option:**
Added an “auto” option to the text size settings for better display flexibility.
- **Pair Volume Tooltip:**
When hovering over the “Volume” cell in the table, a tooltip now shows the volume for each pair (e.g., BTCUSDT, BTCUSDC) for that exchange.
- If the volume is unavailable, it displays "---".
- If the volume is zero, it displays "0".
Korumalı komut dosyası
Bu komut dosyası kapalı kaynak olarak yayınlanmaktadır. Ancak, ücretsiz ve herhangi bir sınırlama olmaksızın kullanabilirsiniz – daha fazla bilgiyi buradan edinebilirsiniz.
Feragatname
Bilgiler ve yayınlar, TradingView tarafından sağlanan veya onaylanan finansal, yatırım, alım satım veya diğer türden tavsiye veya öneriler anlamına gelmez ve teşkil etmez. Kullanım Koşulları bölümünde daha fazlasını okuyun.