GAPs and AVPIs by BULL┃NET
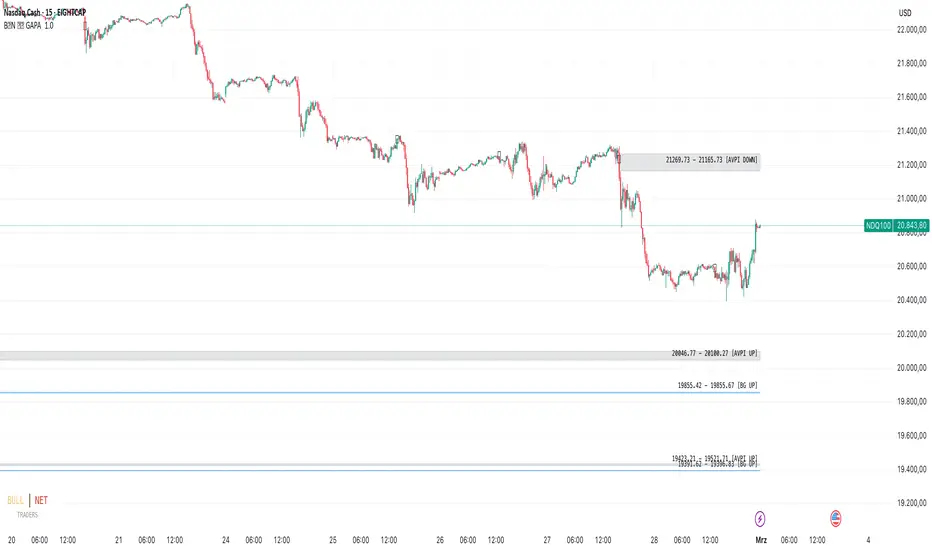
indicator helps traders to identify gaps between bars and imbalances in price and
volume.
read the 2 Disclaimers before use!
Disclaimer BullNett:
The information provided in this document is for educational and informational purposes only and does not constitute financial, investment, or trading advice. Any use of the content is at your own risk. No liability is assumed for any losses or damages resulting from reliance on this information. Trading financial instruments involves significant risks, including the potential loss of all invested capital. There is no guarantee of profits or specific outcomes. Please conduct your own research and consult a professional financial advisor if needed.
Disclaimer TradingView:
According to the tradingview.com/support/solutions/43000591638-our-house-rules/]house
Gaps and imbalances are considered important price levels or ranges because the
price usually tends to close gaps and to get rid of imbalances sooner or later. At the
same time, gaps can deliver support or resistance and tell you a lot about market
sentiment.
Knowing where gaps and imbalances are or have been is vital for successful trading.
Read bevor use!!
Concepts and Functionality:
AVPI: Assumed Volume Price Imbalance
The price curve on a chart is like waves on the ocean. It goes up and
down and sometimes it is smooth. More wind means higher waves and if
the wind slows down the waves get smaller. An under sea earthquake
can cause a tsunami which is the exception of the rule: Extremely higher
waves without more wind.
This is what we consider an AVPI. The price is rising or falling sharply at
a single bar with only slightly increased or even decreased volume. The
change in price seems to be rather the result of a single event than of a
broader change in market sentiment. Such an imbalance is subject to be
corrected sooner or later: the price will return to where the imbalance
started. The Gap will get closed.
AVPIs can be spotted in any timeframe across any asset. And most
importantly you will usually see them at any broker for the same asset.
No matter whether you look i.e. at the original Nasdaq (NASDAQ:NDX)
chart or at the corresponding charts of CFD brokers.
Using the historical display feature of the indicator you will spot price
ranges where a couple of bearish and bullish AVPIs take turns. This is
usually the result of bears and bulls fighting for dominance. Play with the
historical display and the replay feature of TradingView to get a feeling
how things developed depending on who won the fight.
Candle Gaps
If the high and low of two consecutive candles do not overlap we talk
about a candle gap. Other than AVPIs which can be spotted across any
broker Candle Gaps are specific to a broker, the asset and the chart.
If you spot the same Candle Gap across different brokers and the original
chart, i.e. NASDAQ:NDX if you trade the Nasdaq, the Gap can be
considered meaningful and important because it marks a price range in
the market that hasn’t been traded at all (nobody was willing to sell or
buy in that price range).
Candle Gaps are usually closed within a very
short time. Often, you can see these gaps being filled on the same day,
but depending on the asset, they can also remain open for days.
Body Gaps
If you compare the high or low of the current bar with the open or close
of the bar before you will see there are times where the current extreme
does not overlap with the body of the previous bar. This is called a Body
Gap.
If the Body Gap extends a Candle Gap (see impressions section below)
to the body of the previous bar you should consider the Body Gap to be
a bigger Candle Gap.
If several Body Gaps occur in quick succession in a trend they indicate
acceleration and maybe an upcoming exhaustion of the trend.
Combined with the B | N – TREX by BULL|NETT you might find a good trend entry (see
impressions section below).
Single Body Gaps usually do not have much impact other than indicating
the price will likely turn quickly to close the Gap.
It is important to note Body Gaps should always be verified in the 1
minute time frame. You might see a body gap in the 3 minute timeframe
but not below because of the calculation of the Body in the higher time
frame. (see impressions section below)
AVPI OPTIONS
Default assumption for an AVPI:
• If the current bar height (high – low) is at least three times bigger
(growth >= 200%) than the height of the bar before (high[1] –
low[1])
• And the current bar body (open – close or close – open) measures
at least 70% of its total height (high - low)
• And the growth of volume since the last bar (volume – volume[1]) is
not bigger than 1.5 times (growth <= 50%) the growth of the current
bar height
Example:
Current bar height: 13205.10 Previous bar height: 2500.60 Growth of
height = 13205.10 / 2500.60 = 5.28 times bigger Growth of height in
percent (GoH) = 13205.10 * 100 / 2500.60 – 100 = 428.08%
Current bar height: 13205.10 Current bar body: 11007.72 Proportion of
body (PoB): 11007.72 * 100 / 13205.10 = 83.36%
Current bar volume: 608470.00 Previous bar volume: 357365.00 Change
in volume: 608470 * 100 / 357365 – 100 = 70.27% Max. change in
volume allowed: 428.08 * 50% = 214%
Condition check: Growth of height (GoH) in percent 428.08% > 200%
Proportion of body 83.36% > 70% Growth of volume (GoV) 70.27% <
214%
All conditions are true and we can assume a volume to price imbalance.
The following settings allow you to modify the calculation parameters.
The defaults deliver highly reliable results across all markets and assets.
Any changes may end in displaying false results.
Settings:
● Maximum GoV in percent The default maximum growth of volume is
50% of the growth of height. You can change it down to 25% in steps of
1%. This setting decreases the allowed maximum growth of volume. The
calculation becomes more strict.
● Minimum GoH in percent The default minimum growth of height of the
current bar compared to the previous bar is 200%. You can change the
setting between 150% and 250%. The previous bar is taken as 100%. A
growth by 100% means the current bar height is two times the height of
the previous bar. If the previous bar has a height of 50 points, a growth of
200% expects the current height to be 150 (50 + 2 * 50) points. A setting
of 150% results in 125 (50 + 50 + 25) points, and 250% gives 175 (50 +
2 * 50 + 25) points.
● Minimum PoB in percent The default minimum proportion of the current
bar's body of its height is 70%. You can choose a value between 65%
and 90%. The height of the bar (high – low) is always 100%. If you
reduce the setting, you allow a smaller body (larger wicks). If you raise
the setting, you demand a larger body (less wicks).
● AVPIs By default, AVPI calculation and display are enabled. For
backtesting purposes, you can switch them off.
The two color fields allow you to differentiate between AVPIs with
increasing and decreasing volume. A lower volume at the current bar
than at the previous bar while the bar height is growing can tell you
something about the market sentiment in higher timeframes.
The text color field allows you to change the color of the range display in
the AVPI box.
● AVPI Insight By default, you will see a small 🛈 in the middle of the
AVPI bar. The tooltip of the label contains all parameters as shown in the
example calculation above. If you don’t need it, you can disable this
feature. The other two fields determine the color and size of the 🛈.
— Body and Candle Gap Options
● Body Gaps By default, the display of Body Gaps is enabled. You can
disable it for backtesting purposes. Change the color of the box and text
to your liking.
● Candle Gaps By default, the display of Candle Gaps is enabled. You
can disable it for backtesting purposes. Change the color of the box and
text to your liking.
— HISTORICAL OPTIONS
All historical options are for backtesting and learning purposes only.
● Show past AVPIs If enabled, the live display of AVPIs is switched off.
Select the number of the latest AVPIs to display. You can differentiate
between bullish (up) and bearish (down) AVPIs. Past AVPIs will be
displayed in their dimension at the moment they occurred.
● Show past Body Gaps If enabled, the live display of Body Gaps is
switched off. Select the number of the latest Body Gaps to display. You
can differentiate between bullish (up) and bearish (down) Body Gaps.
Past Body Gaps will be displayed in their dimension at the moment they
occurred.
● Show past Candle Gaps If enabled, the live display of Candle Gaps is
switched off. Select the number of the latest Candle Gaps to display. You
can differentiate between bullish (up) and bearish (down) Candle Gaps.
Past Candle Gaps will be displayed in their dimension at the moment
they occurred.
— DISPLAY OPTIONS
● 2 Decimals To streamline the appearance of prices, they are set to
display two decimals only. Numbers get rounded! However, trading
currency pairs or crypto assets might need to display the full amount of
decimals. In this case, simply disable the setting “2 Decimals.”
● Show Gap Range By default, each Gap Box will contain its range.
Depending on the direction (up/down), the range is displayed from
Bottom to Top or vice versa. If you want a cleaner chart, you can disable
the range.
— NERDS ONLY
These options are for nerdy pro-traders. For most of them, you need
knowledge about the Pine Protocol Console. If you have no idea what I
am talking about, these features are not for you.
● Bar Details In replay mode, you will see the details of the current bar in
the pine protocol.
_____________________________________________
Disclaimer BullNett:
The information provided in this document is for educational and informational purposes only and does not constitute financial, investment, or trading advice. Any use of the content is at your own risk. No liability is assumed for any losses or damages resulting from reliance on this information. Trading financial instruments involves significant risks, including the potential loss of all invested capital. There is no guarantee of profits or specific outcomes. Please conduct your own research and consult a professional financial advisor if needed.
Disclaimer TradingView:
According to the tradingview.com/support/solutions/43000591638-our-house-rules/]house
Copyright: 2025-BULLNET - All rights reserved/b]
Roadmap:
Version 1.0 28.02.2025
Yalnızca davetli komut dosyası
Bu komut dosyasına yalnızca yazar tarafından onaylanan kullanıcılar erişebilir. Kullanmak için izin istemeniz ve almanız gerekir. Bu genellikle ödeme yapıldıktan sonra verilir. Daha fazla ayrıntı için aşağıdaki yazarın talimatlarını izleyin veya doğrudan BullNet-traders ile iletişime geçin.
TradingView, yazarına tamamen güvenmediğiniz ve nasıl çalıştığını anlamadığınız sürece bir komut dosyası için ödeme yapmanızı veya kullanmanızı TAVSİYE ETMEZ. Ayrıca topluluk komut dosyalarımızda ücretsiz, açık kaynaklı alternatifler bulabilirsiniz.
Yazarın talimatları
Feragatname
Yalnızca davetli komut dosyası
Bu komut dosyasına yalnızca yazar tarafından onaylanan kullanıcılar erişebilir. Kullanmak için izin istemeniz ve almanız gerekir. Bu genellikle ödeme yapıldıktan sonra verilir. Daha fazla ayrıntı için aşağıdaki yazarın talimatlarını izleyin veya doğrudan BullNet-traders ile iletişime geçin.
TradingView, yazarına tamamen güvenmediğiniz ve nasıl çalıştığını anlamadığınız sürece bir komut dosyası için ödeme yapmanızı veya kullanmanızı TAVSİYE ETMEZ. Ayrıca topluluk komut dosyalarımızda ücretsiz, açık kaynaklı alternatifler bulabilirsiniz.