OPEN-SOURCE SCRIPT
Dollar Volume Last 20 Candles
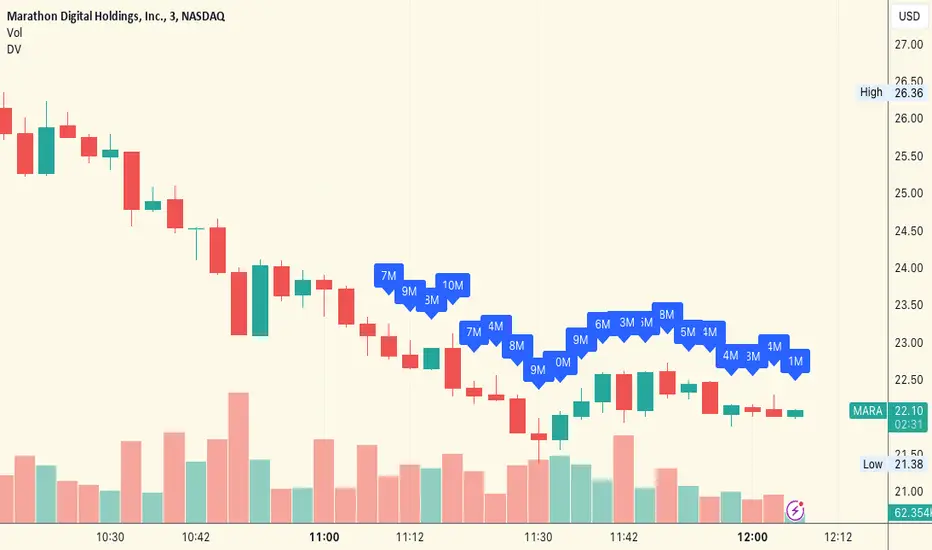
The "Dollar Volume Last 20 Candles" indicator, abbreviated as "DV", is a practical and insightful tool for traders and analysts.
This indicator focuses on enhancing the visualization of trading data by calculating and displaying the dollar volume for each of the last 20 bars on a financial chart. It achieves this by multiplying the closing price of each bar with its trading volume, providing a clear dollar value of the trading activity.
The script also features an intuitive formatting system that simplifies large numbers into 'k' (thousands) and 'M' (millions), making the data easily digestible.
The dollar volume data is displayed directly above each bar, adjusted for visibility using the Average True Range (ATR), ensuring that it is both unobtrusive and readily accessible. This overlay feature integrates seamlessly with the existing chart, offering traders a quick and efficient way to assess monetary trading volume at a glance, which is particularly useful for identifying trends and market strength.
Açık kaynak kodlu komut dosyası
Gerçek TradingView ruhuyla, bu komut dosyasının mimarı, yatırımcıların işlevselliğini inceleyip doğrulayabilmesi için onu açık kaynaklı hale getirdi. Yazarı tebrik ederiz! Ücretsiz olarak kullanabilseniz de, kodu yeniden yayınlamanın Topluluk Kurallarımıza tabi olduğunu unutmayın.
Feragatname
Bilgiler ve yayınlar, TradingView tarafından sağlanan veya onaylanan finansal, yatırım, alım satım veya diğer türden tavsiye veya öneriler anlamına gelmez ve teşkil etmez. Kullanım Koşulları bölümünde daha fazlasını okuyun.