PROTECTED SOURCE SCRIPT
JPCOQ Ichimoku V2
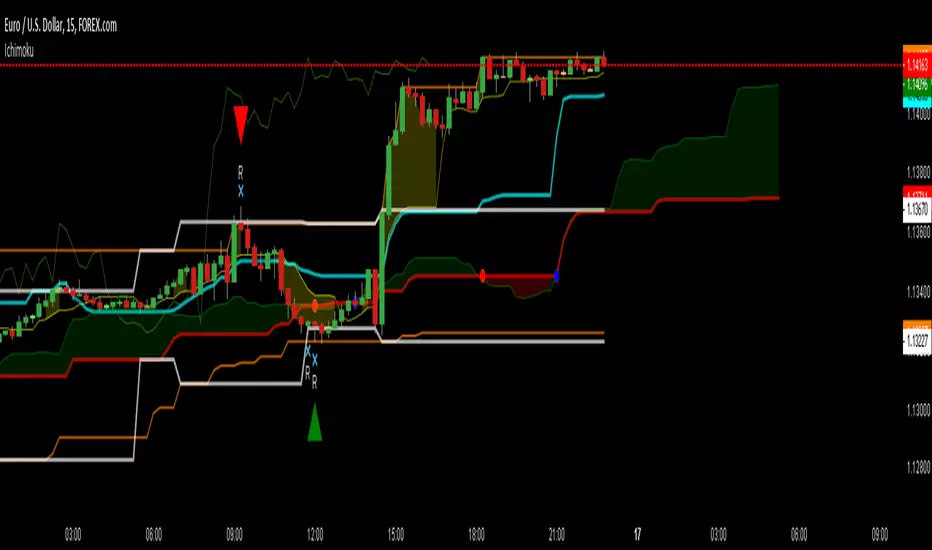
INDICATORS:
Show Yellow zone between price and tenkan when oversold/overbought
Show splits : white when to come, yellow when occurs, red when occurs with a flat Senkou Span B, blue when occurs with a flat Senkou Span B and kijun
Show probable range in white lines
Show last higher highs & lower lows in orange lines
SIGNALS (when ichimoku meet candle patterns)
L/H = rebound signals on higher highs / Lower Lows, target can be lower kj flat
C = potential rebound on overbought oversold zone, target can be lower kj flat
R = rebound signal on range edges, target can be last split
B = pullback/throwback rebound after break out of probable range, target can be last higher high (lower low)
K = rebound on Kj in a trend (out of range), target can be last higher high (lower low)
OTHER PARAMETERS
checkHaram = take Harami pattern into account
CheckallCandle = include all candle patterns
checkVol = show "V" when volume is higher than last 9 periods average
showFuture = next kijun/ssa/ssb values in thin lines
closeToChikou = the greater the value close to ichimoku lines is the test
showChikou = red cross on price when close to chikou in TF or upper one
Flatlen = bars of same value to validate an ichimoku flat
CheckSignal1 = check and show upper TF signals => manual check because not perfect, to unset when study error message !!
ShowEntry = green buy signal (red sell) when buy signal and chikou free and ratio >=2
Korumalı komut dosyası
Bu komut dosyası kapalı kaynak olarak yayınlanmaktadır. Ancak, ücretsiz ve herhangi bir sınırlama olmaksızın kullanabilirsiniz – daha fazla bilgiyi buradan edinebilirsiniz.
Feragatname
Bilgiler ve yayınlar, TradingView tarafından sağlanan veya onaylanan finansal, yatırım, alım satım veya diğer türden tavsiye veya öneriler anlamına gelmez ve teşkil etmez. Kullanım Koşulları bölümünde daha fazlasını okuyun.