Merek Equal Highs and Lows
Description:
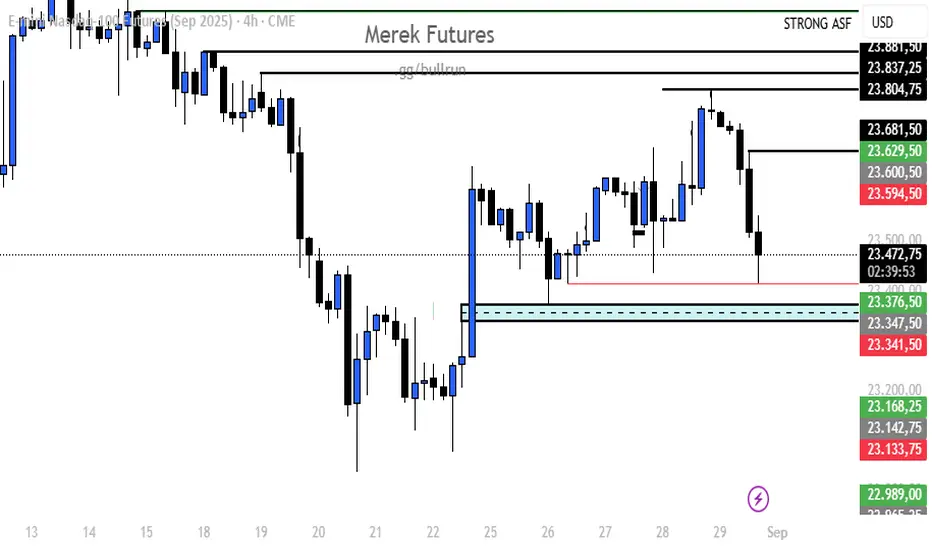
The EQH indicator detects Equal Highs on the chart. This occurs when price reaches the same high level two or more times without breaking it decisively.
Interpretation:
Liquidity zone: Equal highs are often seen as areas where liquidity (stop-loss clusters) is located.
Breakout potential: A break above this level often signals that liquidity is being taken before either a reversal or continuation of the trend.
Market structure: EQH highlights resistance areas that can serve as key decision points for traders.
Use cases:
Identifying potential stop-hunt zones
Spotting resistance levels
Anticipating liquidity grabs before reversals or trend continuations
EQL – Equal Lows Indicator
Description:
The EQL indicator detects Equal Lows on the chart. This occurs when price reaches the same low level two or more times without breaking lower.
Interpretation:
Liquidity zone: Equal lows are areas where liquidity (sell-side stops) tends to accumulate.
Breakout potential: A move below this level often indicates liquidity being swept before a possible reversal or continuation.
Market structure: EQL highlights support areas that can be critical for trade decisions.
Use cases:
Identifying sell-side liquidity zones
Spotting support levels
Recognizing possible stop-hunts before reversals or trend continuations
Yalnızca davetli komut dosyası
Bu komut dosyasına yalnızca yazar tarafından onaylanan kullanıcılar erişebilir. Kullanmak için izin istemeniz ve almanız gerekir. Bu genellikle ödeme yapıldıktan sonra verilir. Daha fazla ayrıntı için aşağıdaki yazarın talimatlarını izleyin veya doğrudan Merek_Real ile iletişime geçin.
TradingView, yazarına tamamen güvenmediğiniz ve nasıl çalıştığını anlamadığınız sürece bir komut dosyası için ödeme yapmanızı veya kullanmanızı TAVSİYE ETMEZ. Ayrıca topluluk komut dosyalarımızda ücretsiz, açık kaynaklı alternatifler bulabilirsiniz.
Yazarın talimatları
Feragatname
Yalnızca davetli komut dosyası
Bu komut dosyasına yalnızca yazar tarafından onaylanan kullanıcılar erişebilir. Kullanmak için izin istemeniz ve almanız gerekir. Bu genellikle ödeme yapıldıktan sonra verilir. Daha fazla ayrıntı için aşağıdaki yazarın talimatlarını izleyin veya doğrudan Merek_Real ile iletişime geçin.
TradingView, yazarına tamamen güvenmediğiniz ve nasıl çalıştığını anlamadığınız sürece bir komut dosyası için ödeme yapmanızı veya kullanmanızı TAVSİYE ETMEZ. Ayrıca topluluk komut dosyalarımızda ücretsiz, açık kaynaklı alternatifler bulabilirsiniz.