OPEN-SOURCE SCRIPT
Güncellendi [blackcat] L2 Vitali Apirine Stochastic MACD Oscillator
Level 2
Background
Traders’ Tips of November 2019, the focus is Vitali Apirine’s article in the November issue, “The Stochastic MACD Oscillator”.
Function
In “The Stochastic MACD Oscillator” in this issue, author Vitali Apirine introduces a new indicator created by combining the stochastic oscillator and the MACD. He describes the new indicator as a momentum oscillator and explains that it allows the trader to define overbought and oversold levels similar to the classic stochastic but based on the MACD. The STMACD reflects the convergence and divergence of two moving averages relative to the high–low range over a set number of periods.
Remarks
This is a Level 2 free and open source indicator.
Feedbacks are appreciated.
Sürüm Notları
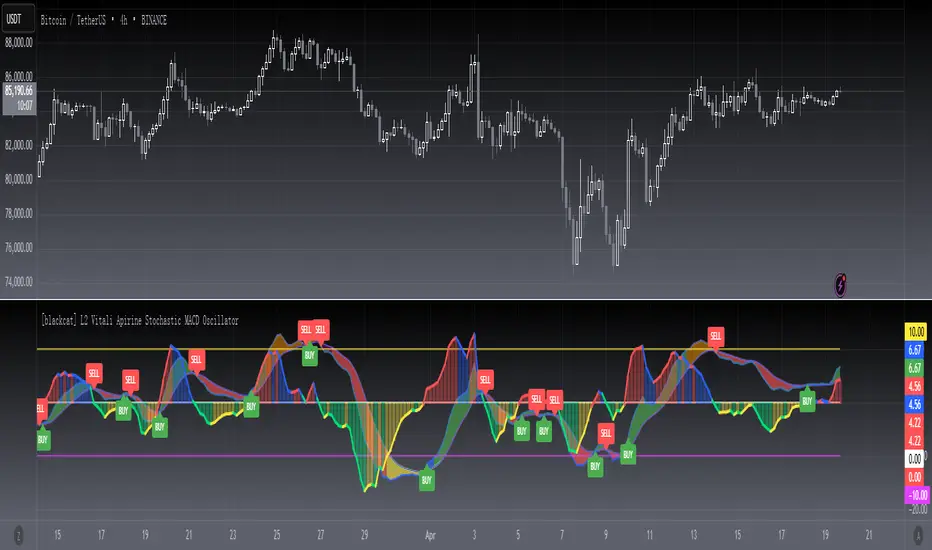
OVERVIEWThe [blackcat] L2 Vitali Apirine Stochastic MACD Oscillator combines elements of the Stochastic oscillator and Moving Average Convergence Divergence (MACD) to provide a unique perspective on market momentum. This indicator plots the Stochastic MACD line along with its average, highlighting overbought and oversold conditions. It also includes a momentum histogram and generates buy/sell signals with corresponding alerts 📊↗️.
FEATURES
Calculates Stochastic MACD using customizable parameters:
Periods
Fast EMA Length
Slow EMA Length
Stochastic MACD Length
Overbought/Oversold Levels
Plots the following lines on the chart:
Stochastic MACD
Stochastic MACD Average
Zero Line, Overbought, and Oversold Levels
Displays a dynamic momentum histogram indicating strength and direction of trends.
Generates buy ('BUY') and sell ('SELL') signals based on crossovers between Stochastic MACD and its average 🚀📉
Adds visual labels for easy identification of trade signals.
Provides alert conditions for both buy and sell signals 🔔
HOW TO USE
Add the indicator to your TradingView chart by selecting it from the indicators list.
Monitor the plotted Stochastic MACD and its average for potential trend changes.
Observe the momentum histogram for indications of trend strength.
Look out for buy ('BUY') and sell ('SELL') labels on the chart for trading opportunities.
Set up alerts based on the generated signals to receive notifications when conditions are met 📲.
Combine this indicator with other tools for confirmation before making trading decisions.
INPUT PARAMETERS
Periods: Define the lookback period for calculating highs and lows.
Fast EMA Length: Set the length for the fast Exponential Moving Average.
Slow EMA Length: Set the length for the slow Exponential Moving Average.
Stochastic MACD Length: Define the smoothing length for the Stochastic MACD.
Overbought Level: Set the threshold for overbought conditions.
Oversold Level: Set the threshold for oversold conditions.
LIMITATIONS
The indicator may generate false signals in choppy or ranging markets 🌪️.
Users should always confirm signals with other forms of analysis.
Customization is required to fit different market conditions and timeframes.
NOTES
Ensure that you have sufficient historical data available for accurate calculations.
Test the indicator thoroughly on demo accounts before applying it to live trading 🔍.
Adjust input parameters as needed to suit various trading strategies.
Açık kaynak kodlu komut dosyası
Gerçek TradingView ruhuyla, bu komut dosyasının mimarı, yatırımcıların işlevselliğini inceleyip doğrulayabilmesi için onu açık kaynaklı hale getirdi. Yazarı tebrik ederiz! Ücretsiz olarak kullanabilseniz de, kodu yeniden yayınlamanın Topluluk Kurallarımıza tabi olduğunu unutmayın.
Avoid losing contact!Don't miss out! The first and most important thing to do is to join my Discord chat now! Click here to start your adventure: discord.com/invite/ZTGpQJq 防止失联,请立即行动,加入本猫聊天群: discord.com/invite/ZTGpQJq
Feragatname
Bilgiler ve yayınlar, TradingView tarafından sağlanan veya onaylanan finansal, yatırım, alım satım veya diğer türden tavsiye veya öneriler anlamına gelmez ve teşkil etmez. Kullanım Koşulları bölümünde daha fazlasını okuyun.