OPEN-SOURCE SCRIPT
Green Line Breakout (GLB) - Public Use
NOTE: This is public use - open source version of GLB published by me in Sep 2020. As Trading View is not allow unprotect script already shared, I am sharing it for anyone to use the script and make a copy.
========
This is an implementation of Green Line Breakout ( GLB ) which is popularized by Eric Wish through his Wishing Wealth Blog.
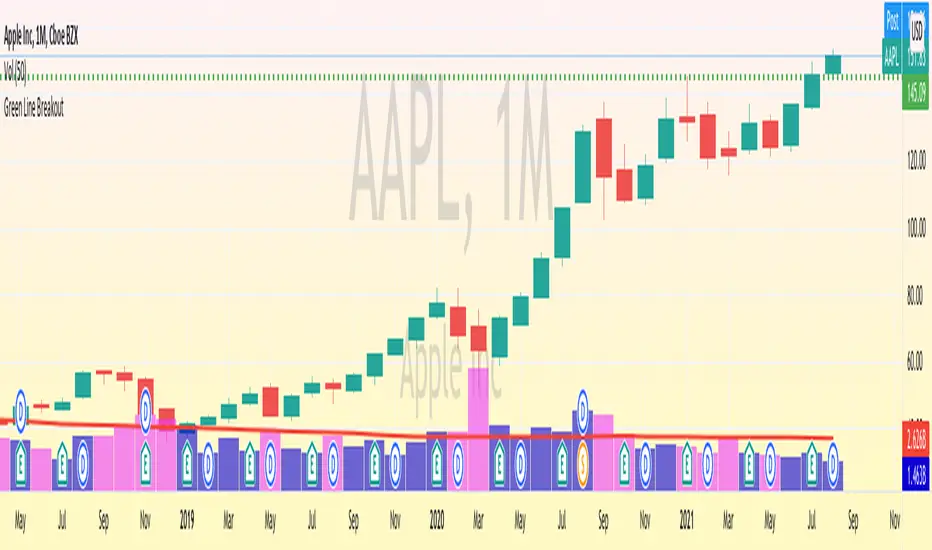
GLB indicator looks at a monthly chart for a stock that hit a new all time high recently and draw a green horizontal line at the highest price reached at any month, that has not been surpassed for at least 3 months.
In other words, this method finds stock that reached an all-time high and has then rested for at least three months. When a stock moves through the green line or is above its last green line, it is an indication of strong buying interest.
Read more about how to use the indicator in Wishing Wealth Blog.
Usage Explanation:
1. Set the time frame to Monthly for a stock and automatically a green dashed line appears based on the calculation explained above
2. If no GLB found for a stock, then green line appears at 0.0
2. If you set any other time frame other than Monthly, no Green Dashed line shown
========
This is an implementation of Green Line Breakout ( GLB ) which is popularized by Eric Wish through his Wishing Wealth Blog.
GLB indicator looks at a monthly chart for a stock that hit a new all time high recently and draw a green horizontal line at the highest price reached at any month, that has not been surpassed for at least 3 months.
In other words, this method finds stock that reached an all-time high and has then rested for at least three months. When a stock moves through the green line or is above its last green line, it is an indication of strong buying interest.
Read more about how to use the indicator in Wishing Wealth Blog.
Usage Explanation:
1. Set the time frame to Monthly for a stock and automatically a green dashed line appears based on the calculation explained above
2. If no GLB found for a stock, then green line appears at 0.0
2. If you set any other time frame other than Monthly, no Green Dashed line shown
Açık kaynak kodlu komut dosyası
Gerçek TradingView ruhuyla, bu komut dosyasının mimarı, yatırımcıların işlevselliğini inceleyip doğrulayabilmesi için onu açık kaynaklı hale getirdi. Yazarı tebrik ederiz! Ücretsiz olarak kullanabilseniz de, kodu yeniden yayınlamanın Topluluk Kurallarımıza tabi olduğunu unutmayın.
Feragatname
Bilgiler ve yayınlar, TradingView tarafından sağlanan veya onaylanan finansal, yatırım, alım satım veya diğer türden tavsiye veya öneriler anlamına gelmez ve teşkil etmez. Kullanım Koşulları bölümünde daha fazlasını okuyun.