OPEN-SOURCE SCRIPT
FIB vs HL
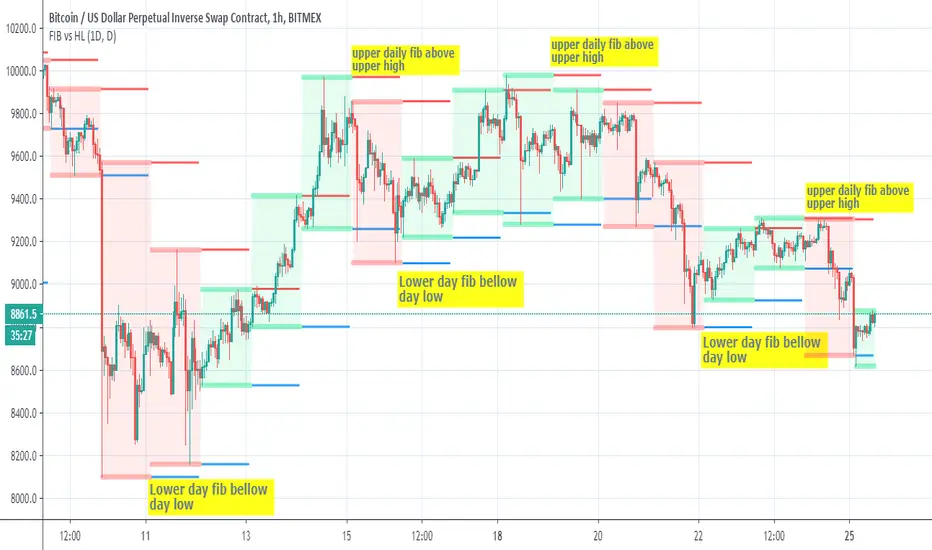
This script show the relation bettwen daily fib seen in red =upper and blue=lower to daily candles upper and lower
since there is slight variation how both calculated we can see that when daily fib is lower then the low candles daily low then there is a good chance for a buy trend
and vice versa in oposite direction
so it just a nice idea that need further verification
since there is slight variation how both calculated we can see that when daily fib is lower then the low candles daily low then there is a good chance for a buy trend
and vice versa in oposite direction
so it just a nice idea that need further verification
Açık kaynak kodlu komut dosyası
Gerçek TradingView ruhuyla, bu komut dosyasının mimarı, yatırımcıların işlevselliğini inceleyip doğrulayabilmesi için onu açık kaynaklı hale getirdi. Yazarı tebrik ederiz! Ücretsiz olarak kullanabilseniz de, kodu yeniden yayınlamanın Topluluk Kurallarımıza tabi olduğunu unutmayın.
Feragatname
Bilgiler ve yayınlar, TradingView tarafından sağlanan veya onaylanan finansal, yatırım, alım satım veya diğer türden tavsiye veya öneriler anlamına gelmez ve teşkil etmez. Kullanım Koşulları bölümünde daha fazlasını okuyun.