PROTECTED SOURCE SCRIPT
SAR Oscillator [Bellsz]
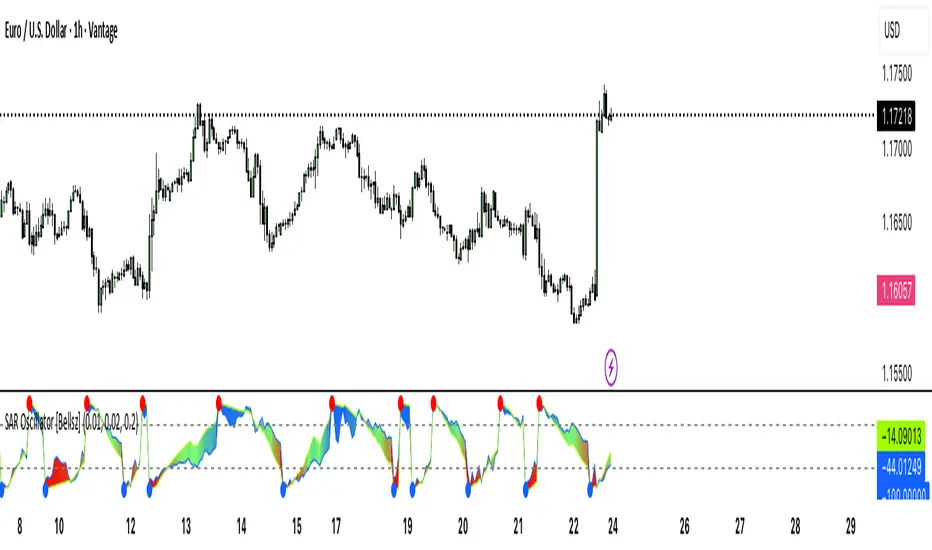
Converts Parabolic SAR into a normalized oscillator with crossover signals, gradient fills, and trend strength levels. A cleaner way to read SAR momentum. Making it easier to read momentum shifts, trend strength, and reversals directly in the sub-chart. Instead of dots on price only, this tool converts SAR dynamics into a smooth oscillator that highlights bias and turning points.
What it shows
Why use it
Inputs
Best practices
Notes
What it shows
- Normalized Price Line — scaled view of price relative to SAR.
- Normalized SAR Line — SAR value normalized across the high/low range.
- SAR Dots — visual cue when crossovers occur (potential reversal or trend acceleration).
- Gradient Fill — color-coded background for quick read of momentum direction/intensity.
- Guide Levels — ±50 baseline to track trend strength and overextension.
Why use it
- Converts SAR into an oscillator format, easier to compare across instruments & timeframes.
- Highlights momentum shifts early (crossovers, gradient flips).
- Adds structure with gradient fill and baselines, making SAR more actionable than standard dot plots.
- Works as a trend bias filter or confirmation tool alongside other indicators.
Inputs
- Acceleration / Increment / Maximum — adjust SAR sensitivity.
- Custom Colors — choose your scheme for price, SAR, and gradients.
Best practices
- Use on intraday or swing TFs as a trend bias filter.
- Look for Normalized Price crossing Normalized SAR as potential entry signals.
- Watch how SAR dots cluster near ±100 for exhaustion or reversal signals.
Notes
- This is a visual enhancement of SAR; it does not repaint.
- Combine with volume, FVGs, or session models for added context.
Korumalı komut dosyası
Bu komut dosyası kapalı kaynak olarak yayınlanmaktadır. Ancak, ücretsiz ve herhangi bir sınırlama olmaksızın kullanabilirsiniz – daha fazla bilgiyi buradan edinebilirsiniz.
Feragatname
Bilgiler ve yayınlar, TradingView tarafından sağlanan veya onaylanan finansal, yatırım, alım satım veya diğer türden tavsiye veya öneriler anlamına gelmez ve teşkil etmez. Kullanım Koşulları bölümünde daha fazlasını okuyun.